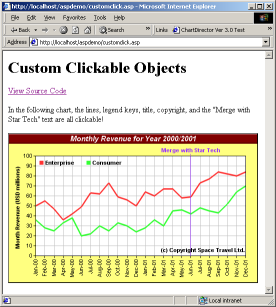
In this example, a clickable line chart will be created with legend keys, a
title box, a vertical mark with label, and a custom text box. All these objects
will be clickable in addition to the lines and the data points.
This example also demostrate how to use client side Javascript as the click
handler.
The code for this example is listed below.
[File: phpdemo/customclick.php".]
setBackground(0xffff80, 0x0, 1);
#Set plotarea at (55, 45) with size of 420 x 200 pixels. Use white (0xffffff)
#background. Enable both horizontal and vertical grid by setting their colors to
#light grey (0xc0c0c0)
$plotAreaObj = $c->setPlotArea(55, 45, 420, 200, 0xffffff);
$plotAreaObj->setGridColor(0xc0c0c0, 0xc0c0c0);
#Add a legend box at (55, 45) (top of plot area) using 8 pts Arial Bold font
#with horizontal layout Set border and background colors of the legend box to
#Transparent
$legendBox = $c->addLegend(55, 45, false, "arialbd.ttf", 8);
$legendBox->setBackground(Transparent);
#Reserve 10% margin at the top of the plot area during auto-scaling to leave
#space for the legends.
$c->yAxis->setAutoScale(0.1);
#Add a title to the chart using 11 pts Arial Bold Italic font. The text is white
#0xffffff on a dark red 0x800000 background.
$title = $c->addTitle("Monthly Revenue for Year 2000/2001", "arialbi.ttf", 11,
0xffffff);
$title->setBackground(0x800000, -1, 1);
#Add a title to the y axis
$c->yAxis->setTitle("Month Revenue (USD millions)");
#Set the labels on the x axis. Draw the labels vertical (angle = 90)
$labelsObj = $c->xAxis->setLabels($labels);
$labelsObj->setFontAngle(90);
#Add a vertical mark at x = 17 using a semi-transparent purple (0x809933ff)
#color and Arial Bold font. Attached the mark (and therefore its label) to the
#top x axis.
$xAxis2Obj = $c->xAxis2();
$mark = $xAxis2Obj->addMark(17, 0x809933ff, "Merge with Star Tech",
"arialbd.ttf");
#Set the mark line width to 2 pixels
$mark->setLineWidth(2);
#Set the mark label font color to purple (0x9933ff)
$mark->setFontColor(0x9933ff);
#Add a copyright message at (475, 240) (bottom right of plot area) using Arial
#Bold font
$copyRight = $c->addText(475, 240, "(c) Copyright Space Travel Ltd.",
"arialbd.ttf");
$copyRight->setAlignment(BottomRight);
#Add a line layer to the chart
$layer = $c->addLineLayer();
#Set the default line width to 3 pixels
$layer->setLineWidth(3);
#Add the data sets to the line layer
$layer->addDataSet($data0, -1, "Enterprise");
$layer->addDataSet($data1, -1, "Consumer");
#Create the image and save it in a temporary location
$chart1URL = $c->makeSession("chart1");
#Create an image map for the chart
$chartImageMap = $c->getHTMLImageMap("xystub.php", "",
"title='{dataSetName} @ {xLabel} = USD {value|0} millions'");
#Create an image map for the legend box
$legendImageMap = $legendBox->getHTMLImageMap("javascript:doSomething();", " ",
"title='This legend key is clickable!'");
#Obtain the image map coordinates for the title, mark, and copyright message.
#These will be used to define the image map inline. (See HTML code below.)
$titleCoor = $title->getImageCoor();
$markCoor = $mark->getImageCoor();
$copyRightCoor = $copyRight->getImageCoor();
?>
Custom Clickable Objects
">
View Source Code
In the following chart, the lines, legend keys, title, copyright,
and the "Merge with Star Tech" text are all clickable!
|
In the above code, the chart is created and saved in a
session variable using
BaseChart.makeSession.
An <IMG> tag is used to retrieve the chart with
"myimage.php?<?php echo $chart1URL?>" as the URL. "myimage.php" is a simple utility that
comes with ChartDirector for retrieving images from session variables.
The image map in this example consists of multiple parts. The part for the
line chart is produced using
BaseChart.getHTMLImageMap with "xystub.php" as
the handler:
$chartImageMap = $c->getHTMLImageMap("xystub.php", "",
"title='{dataSetName} @ {xLabel} = USD {value|0} millions'");
|
For demo purpose, "xystub.php" simply displays information on what is clicked.
It's source code is as follows.
[File: phpdemo/xystub.php".]
Simple Clickable XY Chart Handler
">
View Source Code
You have clicked on the following chart element :
- Data Set :
- X Position :
- X Label :
- Data Value :
|
The image map for the legend keys is produced using
LegendBox.getHTMLImageMap.
In this example, a client side Javascript will be executed when the user clicks
on the legend key.
$legendImageMap = $legendBox->getHTMLImageMap("javascript:doSomething();", " ",
"title='This legend key is clickable!'");
|
As shown above, the "javascript:doSomething();" is used as the handler.
ChartDirector will put the handler as "href" attributes in the <AREA>
tags of the image map. The browser will interpret it as a client side
Javascript statement to be executed when the <AREA> tag is clicked.
Note that the second argument to
LegendBox.getHTMLImageMap is set to a space
character. This argument specifies the HTTP query parameters get passed to the
handler. If this argument is an empty string, default query parameters will be
used. In this example, since the handler is a client side Javascript, no HTTP
query parameter is necessary. So a space character is used.
The client side Javascript executed in this example is a function called
"doSomething();". In this example, this just pops up a message.
Most text messages in ChartDirector are represented as
TextBox objects, and
their image map coordinates can be retrieved using
Box.getImageCoor. This
allows <AREA> tags for TextBox objects be created easily.
(For TextBox, there is no "getHTMLImageMap" method. It is because each TextBox
object only has one hot spot. It is more convenient to enter the handler URL and
tool tip text directly into the <AREA> tag, rather than generating them
using getHTMLImageMap.)
In this example, the image map coordinates of the chart title, vertical mark
label, and the copyright message are obtained using
Box.getImageCoor:
$titleCoor = $title->getImageCoor();
$markCoor = $mark->getImageCoor();
$copyRightCoor = $copyRight->getImageCoor();
|
The image map coordinates are then used to make <AREA> tags as follows:
href='javascript:doSomething();'
title='The title is clickable!'>
href='javascript:doSomething();'
title='The "Merge with Star Tech" text is clickable!'>
href='javascript:doSomething();'
title='The copyright text is clickable!'>
|
© 2004 Advanced Software Engineering Limited. All rights reserved.