ChartDirector Ver 3.1 (PHP Edition Edition)

Custom Symbols


This examples demonstrates using external image files as data symbols. This is achieved by using DataSet.setDataSymbol2.

Source Code Listing

[File: phpdemo/customsymbolline.php".]
<?php require_once("../lib/phpchartdir.php"); #The data for the chart 
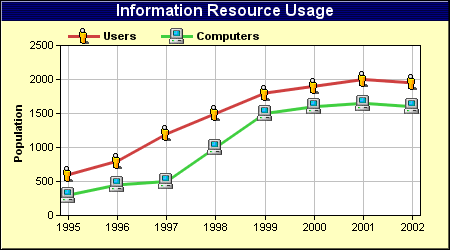
$data0 = array(600, 800, 1200, 1500, 1800, 1900, 2000, 1950); $data1 = array(300, 450, 500, 1000, 1500, 1600, 1650, 1600); #The labels for the chart $labels = array("1995", "1996", "1997", "1998", "1999", "2000", "2001", "2002"); #Create a XYChart object of size 450 x 250 pixels, with a pale yellow (0xffffc0) #background, a black border, and 1 pixel 3D border effect. $c = new XYChart(450, 250, 0xffffc0, 0, 1); #Set the plotarea at (60, 45) and of size 360 x 170 pixels, using white #(0xffffff) as the plot area background color. Turn on both horizontal and #vertical grid lines with light grey color (0xc0c0c0) $c->setPlotArea(60, 45, 360, 170, 0xffffff, -1, -1, 0xc0c0c0, -1); #Add a legend box at (60, 20) (top of the chart) with horizontal layout. Use 8 #pts Arial Bold font. Set the background and border color to Transparent. $legendObj = $c->addLegend(60, 20, false, "arialbd.ttf", 8); $legendObj->setBackground(Transparent); #Add a title to the chart using 12 pts Arial Bold/white font. Use a 1 x 2 bitmap #pattern as the background. $titleObj = $c->addTitle("Information Resource Usage", "arialbd.ttf", 12, 0xffffff); $titleObj->setBackground($c->patternColor(array(0x40, 0x80), 2)); #Set the labels on the x axis $c->xAxis->setLabels($labels); #Reserve 8 pixels margins at both side of the x axis to avoid the first and last #symbols drawing outside of the plot area $c->xAxis->setMargin(8, 8); #Add a title to the y axis $c->yAxis->setTitle("Population"); #Add a line layer to the chart $layer = $c->addLineLayer2(); #Add the first line using small_user.png as the symbol. $dataSetObj = $layer->addDataSet($data0, 0xcf4040, "Users"); $dataSetObj->setDataSymbol2(dirname(__FILE__)."/small_user.png"); #Add the first line using small_computer.png as the symbol. $dataSetObj = $layer->addDataSet($data1, 0x40cf40, "Computers"); $dataSetObj->setDataSymbol2(dirname(__FILE__)."/small_computer.png"); #Set the line width to 3 pixels $layer->setLineWidth(3); #output the chart header("Content-type: image/png"); print($c->makeChart2(PNG)); ?>


x axis. $xAxis2Obj = $c->xAxis2(); $mark = $xAxis2Obj->addMark(17, 0x809933ff, "Merge with Star Tech", "arialbd.ttf"); #Set the mark line width to 2 pixels $mark->setLineWidth(2); #Set the mark label font color to purple (0x9933ff) $mark->setFontColor(0x9933ff); #Add a copyright message at (475, 240) (bottom right of plot area) using Arial #Bold font $copyRight = $c->addText(475, 240, "(c) Copyright Space Travel Ltd.", "arialbd.ttf"); $copyRight->setAlignment(BottomRight); #Add a line layer to the chart $layer = $c->addLineLayer(); #Set the default line width to 3 pixels $layer->setLineWidth(3); #Add the data sets to the line layer $layer->addDataSet($data0, -1, "Enterprise"); $layer->addDataSet($data1, -1, "Consumer"); #Create the image and save it in a temporary location $chart1URL = $c->makeSession("chart1"); #Create an image map for the chart $chartImageMap = $c->getHTMLImageMap("xystub.php", "", "title='{dataSetName} @ {xLabel} = USD {value|0} millions'"); #Create an image map for the legend box $legendImageMap = $legendBox->getHTMLImageMap("javascript:doSomething();", " ", "title='This legend key is clickable!'"); #Obtain the image map coordinates for the title, mark, and copyright message. #These will be used to define the image map inline. (See HTML code below.) $titleCoor = $title->getImageCoor(); $markCoor = $mark->getImageCoor(); $copyRightCoor = $copyRight->getImageCoor(); ?>

Custom Clickable Objects

"> View Source Code

In the following chart, the lines, legend keys, title, copyright, and the "Merge with Star Tech" text are all clickable!

href='javascript:doSomething();' title='The title is clickable!'> href='javascript:doSomething();' title='The "Merge with Star Tech" text is clickable!'> href='javascript:doSomething();' title='The copyright text is clickable!'>
In the above code, the chart is created and saved in a session variable using BaseChart.makeSession. An <IMG> tag is used to retrieve the chart with "myimage.php?<?php echo $chart1URL?>" as the URL. "myimage.php" is a simple utility that comes with ChartDirector for retrieving images from session variables.

The image map in this example consists of multiple parts. The part for the line chart is produced using BaseChart.getHTMLImageMap with "xystub.php" as the handler:

$chartImageMap = $c->getHTMLImageMap("xystub.php", "", "title='{dataSetName} @ {xLabel} = USD {value|0} millions'");

For demo purpose, "xystub.php" simply displays information on what is clicked. It's source code is as follows.

[File: phpdemo/xystub.php".]
<html> <body> <h1>Simple Clickable XY Chart Handler</h1> <p><a href="viewsource.php?file=<?php echo $HTTP_SERVER_VARS["SCRIPT_NAME"]?>"> View Source Code </a></p> <p><b>You have clicked on the following chart element :</b></p> <ul> <li>Data Set : <?php echo $HTTP_GET_VARS["dataSetName"]?></li> <li>X Position : <?php echo $HTTP_GET_VARS["x"]?></li> <li>X Label : <?php echo $HTTP_GET_VARS["xLabel"]?></li> <li>Data Value : <?php echo $HTTP_GET_VARS["value"]?></li> </ul> </body> </html>

The image map for the legend keys is produced using LegendBox.getHTMLImageMap. In this example, a client side Javascript will be executed when the user clicks on the legend key.

$legendImageMap = $legendBox->getHTMLImageMap("javascript:doSomething();", " ", "title='This legend key is clickable!'");

As shown above, the "javascript:doSomething();" is used as the handler. ChartDirector will put the handler as "href" attributes in the <AREA> tags of the image map. The browser will interpret it as a client side Javascript statement to be executed when the <AREA> tag is clicked.

Note that the second argument to LegendBox.getHTMLImageMap is set to a space character. This argument specifies the HTTP query parameters get passed to the handler. If this argument is an empty string, default query parameters will be used. In this example, since the handler is a client side Javascript, no HTTP query parameter is necessary. So a space character is used.

The client side Javascript executed in this example is a function called "doSomething();". In this example, this just pops up a message.

<SCRIPT> function doSomething() { alert("This is suppose to do something meaningful, but for demo " + "purposes, we just pop up this message box to prove that " + "the object can response to mouse clicks."); } </SCRIPT>

Most text messages in ChartDirector are represented as TextBox objects, and their image map coordinates can be retrieved using Box.getImageCoor. This allows <AREA> tags for TextBox objects be created easily.

(For TextBox, there is no "getHTMLImageMap" method. It is because each TextBox object only has one hot spot. It is more convenient to enter the handler URL and tool tip text directly into the <AREA> tag, rather than generating them using getHTMLImageMap.)

In this example, the image map coordinates of the chart title, vertical mark label, and the copyright message are obtained using Box.getImageCoor:

$titleCoor = $title->getImageCoor(); $markCoor = $mark->getImageCoor(); $copyRightCoor = $copyRight->getImageCoor();

The image map coordinates are then used to make <AREA> tags as follows:

<area <?php echo $titleCoor?> href='javascript:doSomething();' title='The title is clickable!'> <area <?php echo $markCoor?> href='javascript:doSomething();' title='The "Merge with Star Tech" text is clickable!'> <area <?php echo $copyRightCoor?> href='javascript:doSomething();' title='The copyright text is clickable!'>


01', '959', '1018', '1102');