In this section, we will present an example that employs both database and image
maps.
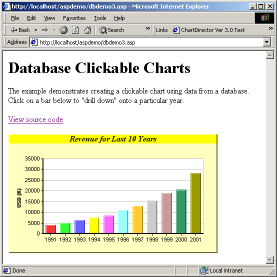
We will display a bar chart that shows the revenue for the last 10 years. When
the user clicks on a bar, it will "drill down" to another bar chart showing the
monthly revenue for the year represented by the bar clicked. All data comes from
a database.
The code that creates the clickable bar chart for the last 10 years are as
follows.
[File: phpdemo/dbdemo3_main.php".]
| <?php
require_once("../lib/phpchartdir.php");
#
#Get the revenue for the last 10 years
#
$SQLstatement =
"Select Sum(Software + Hardware + Services), Year(TimeStamp) " .
"From revenue Where Year(TimeStamp) >= 1991 And Year(TimeStamp) <= 2001 " .
"Group By Year(TimeStamp) Order By Year(TimeStamp)";
#
#Read in the revenue data into arrays
#
mysql_connect("localhost", "test", "test");
$result = mysql_db_query("sample", $SQLstatement);
while ($row = mysql_fetch_row($result)) {
$revenue[] = $row[0];
$timestamp[] = $row[1];
}
#
#Now we obtain the data into arrays, we can start to draw the chart
#using ChartDirector
#
#Create a XYChart of size 420 pixels x 240 pixels
$c = new XYChart(420, 240);
#Set the chart background to pale yellow (0xffffc0) with a 2 pixel 3D border
$c->setBackground(0xffffc0, 0xffffc0, 2);
#Set the plotarea at (70, 50) and of size 320 x 150 pixels. Set background
#color to white (0xffffff). Enable both horizontal and vertical grids by
#setting their colors to light grey (0xc0c0c0)
$c->setPlotArea(70, 50, 320, 150, 0xffffff, 0xffffff, 0xc0c0c0, 0xc0c0c0);
#Add a title to the chart
$title = $c->addTitle("Revenue for Last 10 Years", "timesbi.ttf");
$title->setBackground(0xffff00);
#Add a legend box at the top of the plotarea
$legend = $c->addLegend(70, 30, 0, "", 8);
$legend->setBackground(Transparent);
#Add a multi-color bar chart layer using the supplied data
$layer = $c->addBarLayer3($revenue);
$layer->setBorderColor(Transparent, 1);
#Set the x-axis labels using the supplied labels
$c->xAxis->setLabels($timestamp);
#Set the x-axis width to 2 pixels
$c->xAxis->setWidth(2);
#Set the y axis title
$c->yAxis->setTitle("USD (K)");
#Set the y-axis width to 2 pixels
$c->yAxis->setWidth(2);
#Create the image and save it in a session variable
session_register("chart");
$HTTP_SESSION_VARS["chart"] = $chart = $c->makeChart2(PNG);
$chartURL = "myimage.php?img=chart&id=".uniqid(session_id())."&".SID;
#Create an image map for the chart
$imageMap = $c->getHTMLImageMap("dbdemo3a.php", "",
"title='{xLabel}: USD {value|0}K'");
?>
<html>
<body>
<h1>Database Clickable Charts</h1>
<p style="width:500px;">The example demonstrates creating a clickable chart
using data from a database. Click on a bar below to "drill down" onto a
particular year.</p>
<p><a href="viewsource.php?file=<?php echo $HTTP_SERVER_VARS["SCRIPT_NAME"] ?>">
View source code
</a></p>
<img src="<?php echo $chartURL ?>" border="0" usemap="#map1">
<map name="map1">
<?php echo $imageMap ?>
</map>
</body>
</html> |
The above code first performs a database query and read the data into arrays. It
then uses the data to create a bar chart. The chart is saved in a session
variable using
BaseChart.makeSession
. An <IMG> tag is used to retrieve the
chart with
as the URL. "myimage.php" is a simple utility that comes with ChartDirector
for retrieving images from session variables.
When the user clicks on the bar chart, the handler "dbdemo3a.php" will be
invoked with a number of HTTP query parameters to indicate which bar the user
has clicked. In particular, the xLabel parameter will contain the x-axis label
for the bar clicked. Using the xLabel parameter, the "dbdemo3a.php" knows which
year the user has clicked. It then query the database for the data on that year,
and produces the bar chart for that year.
In this example, the "dbdemo3a.php" will produce another clickable chart using
"xystub.php" as the handler.
[File: phpdemo/dbdemo3a.php".]
| <?php
require_once("../lib/phpchartdir.php");
#
#Retrieve the selected year from the query variable "xLabel"
#
if (isset($HTTP_GET_VARS["year"]))
$SelectedYear = $HTTP_GET_VARS["xLabel"];
else
$SelectedYear = 2001;
#
#Create an SQL statement to get the revenues of each month for the
#selected year. The ArrayIndex will be from 0 - 11, representing Jan - Dec.
#
$SQLstatement = "Select Month(TimeStamp) - 1, Software, Hardware, Services " .
"From revenue Where Year(TimeStamp)=" . $SelectedYear;
#
#Read in the revenue data into arrays
#
mysql_connect("localhost", "test", "test");
$result = mysql_db_query("sample", $SQLstatement);
$software = array_pad(array(), 12, 0);
$hardware = array_pad(array(), 12, 0);
$services = array_pad(array(), 12, 0);
while ($row = mysql_fetch_row($result)) {
$software[$row[0]] = $row[1];
$hardware[$row[0]] = $row[2];
$services[$row[0]] = $row[3];
}
#
#Now we obtain the data into arrays, we can start to draw the chart
#using ChartDirector
#
#Create a XYChart of size 420 pixels x 240 pixels
$c = new XYChart(420, 240);
#Set the chart background to pale yellow (0xffffc0) with a 2 pixel 3D border
$c->setBackground(0xffffc0, 0xffffc0, 2);
#Set the plotarea at (70, 50) and of size 320 x 150 pixels. Set background
#color to white (0xffffff). Enable both horizontal and vertical grids by
#setting their colors to light grey (0xc0c0c0)
$c->setPlotArea(70, 50, 320, 150, 0xffffff, 0xffffff, 0xc0c0c0, 0xc0c0c0);
#Add a title to the chart
$title = $c->addTitle("Revenue for " . $SelectedYear, "timesbi.ttf");
$title->setBackground(0xffff00);
#Add a legend box at the top of the plotarea
$legend = $c->addLegend(70, 30, 0, "", 8);
$legend->setBackground(Transparent);
#Add a stacked bar chart layer using the supplied data
$layer = $c->addBarLayer2(Stack);
$layer->addDataSet($software, -1, "Software");
$layer->addDataSet($hardware, -1, "Hardware");
$layer->addDataSet($services, -1, "Services");
$layer->setBorderColor(Transparent, 1);
#Set the x axis labels. In this example, the labels must be Jan - Dec.
$labels = array("Jan", "Feb", "Mar", "Apr", "May", "Jun", "Jul", "Aug",
"Sept", "Oct", "Nov", "Dec");
$c->xAxis->setLabels($labels);
#Set the x-axis width to 2 pixels
$c->xAxis->setWidth(2);
#Set the y axis title
$c->yAxis->setTitle("USD (K)");
#Set the y-axis width to 2 pixels
$c->yAxis->setWidth(2);
#Create the image and save it in a session variable
session_register("chart");
$HTTP_SESSION_VARS["chart"] = $chart = $c->makeChart2(PNG);
$chartURL = "myimage.php?img=chart&id=".uniqid(session_id())."&".SID;
#Create an image map for the chart
$imageMap = $c->getHTMLImageMap("xystub.php", "",
"title='{dataSetName} @ {xLabel} = USD {value|0}K'");
?>
<html>
<body>
<h1>Database Clickable Chart</h1>
<p style="width:500px;">You have click the bar of the year
<?php echo $HTTP_GET_VARS["xLabel"] ?>. Below is the "drill-down" chart
showing the monthly details.</p>
<p><a href="viewsource.php?file=<?php echo $HTTP_SERVER_VARS["SCRIPT_NAME"] ?>">
View source code
</a></p>
<img src="<?php echo $chartURL ?>" border="0" usemap="#map1">
<map name="map1">
<?php echo $imageMap ?>
</map>
</body>
</html> |
For demo purpose, "xystub.php" simply displays information on what is clicked.
It's source code is as follows.
[File: phpdemo/xystub.php".]
|
<html>
<body>
<h1>Simple Clickable XY Chart Handler</h1>
<p><a href="viewsource.php?file=<?php echo $HTTP_SERVER_VARS["SCRIPT_NAME"]?>">
View Source Code
</a></p>
<p><b>You have clicked on the following chart element :</b></p>
<ul>
<li>Data Set : <?php echo $HTTP_GET_VARS["dataSetName"]?></li>
<li>X Position : <?php echo $HTTP_GET_VARS["x"]?></li>
<li>X Label : <?php echo $HTTP_GET_VARS["xLabel"]?></li>
<li>Data Value : <?php echo $HTTP_GET_VARS["value"]?></li>
</ul>
</body>
</html> |
© 2004 Advanced Software Engineering Limited. All rights reserved.