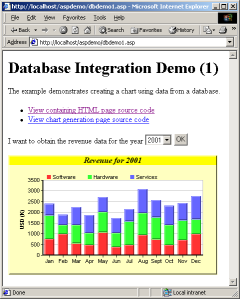
In this example, we will demostrate how to create a web page to show the monthly
revenue for a given year. The user will select a year from a HTML form and press
OK. The web server will query a database to obtain the necessary data, and
return a web page containing the bar chart for the selected year.
The code for producing the HTML form is listed below. It outputs a drop down
select list to allow the user to selecte a year. Based on the selected year, it
uses an <IMG> tag with a ChartDirector script as the URL and the selected
year as query parameter. The ChartDirector script will generate the chart image
based on the selected year and deliver it to the browser.
[File: phpdemo/dbdemo1_main.php".]
| <html>
<body>
<h1>Database Integration Demo (1)</h1>
<p>The example demonstrates creating a chart using data from a database.</p>
<ul>
<li><a href="viewsource.php?file=<?php echo $HTTP_SERVER_VARS["SCRIPT_NAME"] ?>">
View containing HTML page source code
</a></li>
<li><a href="viewsource.php?file=dbdemo1a.php">
View chart generation page source code
</a></li>
</ul>
<form action="<?php echo $HTTP_SERVER_VARS["SCRIPT_NAME"] ?>">
I want to obtain the revenue data for the year
<select name="year">
<option value="1990">1990
<option value="1991">1991
<option value="1992">1992
<option value="1993">1993
<option value="1994">1994
<option value="1995">1995
<option value="1996">1996
<option value="1997">1997
<option value="1998">1998
<option value="1999">1999
<option value="2000">2000
<option value="2001">2001
</select>
<input type="submit" value="OK">
</form>
<?php
if (isset($HTTP_GET_VARS["year"]))
$SelectedYear = $HTTP_GET_VARS["year"];
else
$SelectedYear = 2001;
?>
<SCRIPT>
//make sure the select box displays the current selected year.
document.forms[0].year.selectedIndex = <?=$SelectedYear - 1990?>;
</SCRIPT>
<img src="dbdemo1a.php?year=<?php echo $SelectedYear ?>">
</body>
</html> |
As seen from the code above, the chart is created by the URL in the <IMG>
tag, which is "dbdemo1a.php".
The "dbdemo1a.php" is as follows.
[File: phpdemo/dbdemo1a.php".]
| <?php
require_once("../lib/phpchartdir.php");
#
#Displays the monthly revenue for the selected year. The selected year
#should be passed in as a query parameter called "year"
#
if (isset($HTTP_GET_VARS["year"]))
$SelectedYear = $HTTP_GET_VARS["year"];
else
$SelectedYear = 2001;
#
#Create an SQL statement to get the revenues of each month for the
#selected year.
#
$SQLstatement = "Select Month(TimeStamp) - 1, Software, Hardware, Services " .
"From revenue Where Year(TimeStamp)=" . $SelectedYear;
#
#Read in the revenue data into arrays
#
mysql_connect("localhost", "test", "test");
$result = mysql_db_query("sample", $SQLstatement);
$software = array_pad(array(), 12, 0);
$hardware = array_pad(array(), 12, 0);
$services = array_pad(array(), 12, 0);
while ($row = mysql_fetch_row($result)) {
$software[$row[0]] = $row[1];
$hardware[$row[0]] = $row[2];
$services[$row[0]] = $row[3];
}
#
#Now we obtain the data into arrays, we can start to draw the chart
#using ChartDirector
#
#Create a XYChart of size 420 pixels x 240 pixels
$c = new XYChart(420, 240);
#Set the chart background to pale yellow (0xffffc0) with a 2 pixel 3D border
$c->setBackground(0xffffc0, 0xffffc0, 2);
#Set the plotarea at (70, 50) and of size 320 x 150 pixels. Set background
#color to white (0xffffff). Enable both horizontal and vertical grids by
#setting their colors to light grey (0xc0c0c0)
$c->setPlotArea(70, 50, 320, 150, 0xffffff, 0xffffff, 0xc0c0c0, 0xc0c0c0);
#Add a title to the chart
$title = $c->addTitle("Revenue for " . $SelectedYear, "timesbi.ttf");
$title->setBackground(0xffff00);
#Add a legend box at the top of the plotarea
$legend = $c->addLegend(70, 30, 0, "", 8);
$legend->setBackground(Transparent);
#Add a stacked bar chart layer using the supplied data
$layer = $c->addBarLayer2(Stack);
$layer->addDataSet($software, -1, "Software");
$layer->addDataSet($hardware, -1, "Hardware");
$layer->addDataSet($services, -1, "Services");
$layer->setBorderColor(Transparent, 1);
#Set the x axis labels. In this example, the labels must be Jan - Dec.
$labels = array("Jan", "Feb", "Mar", "Apr", "May", "Jun", "Jul", "Aug",
"Sept", "Oct", "Nov", "Dec");
$c->xAxis->setLabels($labels);
#Set the x-axis width to 2 pixels
$c->xAxis->setWidth(2);
#Set the y axis title
$c->yAxis->setTitle("USD (K)");
#Set the y-axis width to 2 pixels
$c->yAxis->setWidth(2);
#Output the chart
header("Content-type: image/png");
print($c->makeChart2(PNG));
?> |
The first part of the above code is a database query using MySQL. The SQL
statement is:
|
$SQLstatement = "Select Month(TimeStamp) - 1, " .
"Software, Hardware, Services " .
"From revenue Where Year(TimeStamp)=" . $SelectedYear; |
Note that the first column "Month(TimeStamp)-1" will be a number from 0 - 11,
representing Jan - Dec. We can use it as index to the data arrays.
The code then executes the SQL query and read the data into an array using a
loop. In the loop, the data are read using:
|
mysql_connect("localhost", "test", "test");
$result = mysql_db_query("sample", $SQLstatement);
$software = array_pad(array(), 12, 0);
$hardware = array_pad(array(), 12, 0);
$services = array_pad(array(), 12, 0);
while ($row = mysql_fetch_row($result)) {
$software[$row[0]] = $row[1];
$hardware[$row[0]] = $row[2];
$services[$row[0]] = $row[3];
} |
The advantages of using the first column as an "array index" to read the data
into arrays are that it does not require the records to be sorted. It also works
well in case there are some "missing records" in the database.
After we read the data into arrays, the second part of the code is to create a
stacked bar chart using the given data. This is very similar to the examples in
other parts of this documentation, so it will not be explained further.
© 2004 Advanced Software Engineering Limited. All rights reserved.