In this example, we will introduce a technique where the database query is
performed in the containing HTML page, and the data is passed to the
ChartDirector script as HTTP GET query parameters. Using this method, it is
possible to perform one database query and feed the data to multiple charts.
The user will select a year from a HTML form and press OK. The web server
will query a database to obtain the necessary data, and return a web page
containing the bar chart and the line chart for the selected year.
The code for producing the HTML form is listed below.
The code outputs a drop down select list to allow the user to selecte a year.
Based on the selected year, it queries the database and read the data into
arrays. The data are then serialized
into comma delimited strings using the
"join" function.
Two <IMG> tags are used to invoke two scripts for charts generation, where
the data are passed in as HTTP GET query parameters using the comma delimited
strings.
[File: phpdemo/dbdemo2_main.php".]
| <html>
<body>
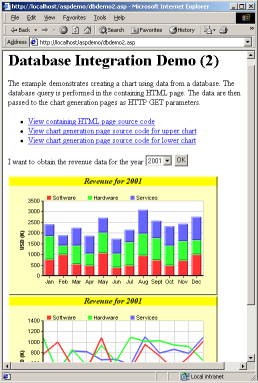
<h1>Database Integration Demo (2)</h1>
<p style="width:500px;">This example demonstrates creating a chart using
data from a database. The database query is performed in the containing
HTML page. The data are then passed to the chart generation pages as
HTTP GET parameters.</p>
<ul>
<li><a href="viewsource.php?file=<?php echo $HTTP_SERVER_VARS["SCRIPT_NAME"] ?>">
View containing HTML page source code
</a></li>
<li><a href="viewsource.php?file=dbdemo2a.php">
View chart generation page source code for upper chart
</a></li>
<li><a href="viewsource.php?file=dbdemo2b.php">
View chart generation page source code for lower chart
</a></li>
</ul>
<form action="<?php echo $HTTP_SERVER_VARS["SCRIPT_NAME"] ?>">
I want to obtain the revenue data for the year
<select name="year">
<option value="1990">1990
<option value="1991">1991
<option value="1992">1992
<option value="1993">1993
<option value="1994">1994
<option value="1995">1995
<option value="1996">1996
<option value="1997">1997
<option value="1998">1998
<option value="1999">1999
<option value="2000">2000
<option value="2001">2001
</select>
<input type="submit" value="OK">
</form>
<?
#
#Perform the database query to get the required data. The selected year
#should be passed in as a query parameter called "year"
#
if (isset($HTTP_GET_VARS["year"]))
$SelectedYear = $HTTP_GET_VARS["year"];
else
$SelectedYear = 2001;
#
#Create an SQL statement to get the revenues of each month for the
#selected year.
#
$SQLstatement = "Select Month(TimeStamp) - 1, Software, Hardware, Services " .
"From revenue Where Year(TimeStamp)=" . $SelectedYear;
#
#Read in the revenue data into arrays
#
mysql_connect("localhost", "test", "test");
$result = mysql_db_query("sample", $SQLstatement);
$software = array_pad(array(), 12, 0);
$hardware = array_pad(array(), 12, 0);
$services = array_pad(array(), 12, 0);
while ($row = mysql_fetch_row($result)) {
$software[$row[0]] = $row[1];
$hardware[$row[0]] = $row[2];
$services[$row[0]] = $row[3];
}
#Serialize the data into a string to be used as HTTP query parameters
$httpParam = "year=" . $SelectedYear . "&software=".join(",", $software) .
"&hardware=".join(",", $hardware) . "&services=".join(",", $services);
?>
<SCRIPT>
//make sure the select box displays the current selected year.
document.forms[0].year.selectedIndex = <?=$SelectedYear - 1990?>;
</SCRIPT>
<img src="dbdemo2a.php?<?php echo $httpParam ?>"><br>
<img src="dbdemo2b.php?<?php echo $httpParam ?>">
</body>
</html> |
The <IMG> tags in the above code invoke "dbdemo2a.php" and
"dbdemo2b.php" for charts generation. In "dbdemo2a.php" and
"dbdemo2b.php", the data is retrieved from the HTTP GET query parameters and
deserialized back into arrays by using the
"split" function.
The data are then used to generate the charts.
[File: phpdemo/dbdemo2a.php".]
| <?php
require_once("../lib/phpchartdir.php");
#
#Retrieve the data from the query parameters
#
if (isset($HTTP_GET_VARS["year"]))
$SelectedYear = $HTTP_GET_VARS["year"];
else
$SelectedYear = 2001;
$software = split(",", $HTTP_GET_VARS["software"]);
$hardware = split(",", $HTTP_GET_VARS["hardware"]);
$services = split(",", $HTTP_GET_VARS["services"]);
#
#Now we obtain the data into arrays, we can start to draw the chart
#using ChartDirector
#
#Create a XYChart of size 420 pixels x 240 pixels
$c = new XYChart(420, 240);
#Set the chart background to pale yellow (0xffffc0) with a 2 pixel 3D border
$c->setBackground(0xffffc0, 0xffffc0, 2);
#Set the plotarea at (70, 50) and of size 320 x 150 pixels. Set background
#color to white (0xffffff). Enable both horizontal and vertical grids by
#setting their colors to light grey (0xc0c0c0)
$c->setPlotArea(70, 50, 320, 150, 0xffffff, 0xffffff, 0xc0c0c0, 0xc0c0c0);
#Add a title to the chart
$title = $c->addTitle("Revenue for " . $SelectedYear, "timesbi.ttf");
$title->setBackground(0xffff00);
#Add a legend box at the top of the plotarea
$legend = $c->addLegend(70, 30, 0, "", 8);
$legend->setBackground(Transparent);
#Add a stacked bar chart layer using the supplied data
$layer = $c->addBarLayer2(Stack);
$layer->addDataSet($software, -1, "Software");
$layer->addDataSet($hardware, -1, "Hardware");
$layer->addDataSet($services, -1, "Services");
$layer->setBorderColor(Transparent, 1);
#Set the x axis labels. In this example, the labels must be Jan - Dec.
$labels = array("Jan", "Feb", "Mar", "Apr", "May", "Jun", "Jul", "Aug",
"Sept", "Oct", "Nov", "Dec");
$c->xAxis->setLabels($labels);
#Set the x-axis width to 2 pixels
$c->xAxis->setWidth(2);
#Set the y axis title
$c->yAxis->setTitle("USD (K)");
#Set the y-axis width to 2 pixels
$c->yAxis->setWidth(2);
#Output the chart
header("Content-type: image/png");
print($c->makeChart2(PNG));
?> |
[File: phpdemo/dbdemo2b.php".]
| <?php
require_once("../lib/phpchartdir.php");
#
#Retrieve the data from the query parameters
#
if (isset($HTTP_GET_VARS["year"]))
$SelectedYear = $HTTP_GET_VARS["year"];
else
$SelectedYear = 2001;
$software = split(",", $HTTP_GET_VARS["software"]);
$hardware = split(",", $HTTP_GET_VARS["hardware"]);
$services = split(",", $HTTP_GET_VARS["services"]);
#
#Now we obtain the data into arrays, we can start to draw the chart
#using ChartDirector
#
#Create a XYChart of size 420 pixels x 240 pixels
$c = new XYChart(420, 240);
#Set the chart background to pale yellow (0xffffc0) with a 2 pixel 3D border
$c->setBackground(0xffffc0, 0xffffc0, 2);
#Set the plotarea at (70, 50) and of size 320 x 150 pixels. Set background
#color to white (0xffffff). Enable both horizontal and vertical grids by
#setting their colors to light grey (0xc0c0c0)
$c->setPlotArea(70, 50, 320, 150, 0xffffff, 0xffffff, 0xc0c0c0, 0xc0c0c0);
#Add a title to the chart
$title = $c->addTitle("Revenue for " . $SelectedYear, "timesbi.ttf");
$title->setBackground(0xffff00);
#Add a legend box at the top of the plotarea
$legend = $c->addLegend(70, 30, 0, "", 8);
$legend->setBackground(Transparent);
#Add a line chart layer using the supplied data
$layer = $c->addLineLayer2();
$dataSet = $layer->addDataSet($software, -1, "Software");
$dataSet->setLineWidth(3);
$dataSet = $layer->addDataSet($hardware, -1, "Hardware");
$dataSet->setLineWidth(3);
$dataSet = $layer->addDataSet($services, -1, "Services");
$dataSet->setLineWidth(3);
$layer->setBorderColor(Transparent, 1);
#Set the x axis labels. In this example, the labels must be Jan - Dec.
$labels = array("Jan", "Feb", "Mar", "Apr", "May", "Jun", "Jul", "Aug",
"Sept", "Oct", "Nov", "Dec");
$c->xAxis->setLabels($labels);
#Set the x-axis width to 2 pixels
$c->xAxis->setWidth(2);
#Set the y axis title
$c->yAxis->setTitle("USD (K)");
#Set the y-axis width to 2 pixels
$c->yAxis->setWidth(2);
#Output the chart
header("Content-type: image/png");
print($c->makeChart2(PNG));
?> |
© 2004 Advanced Software Engineering Limited. All rights reserved.