| <?php
require_once("../lib/phpchartdir.php");
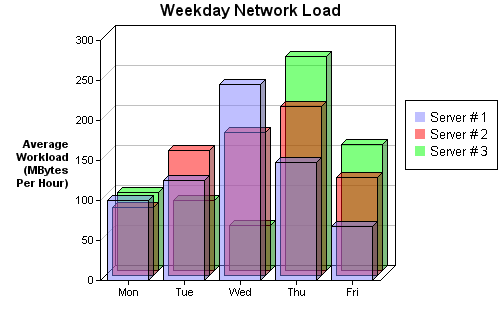
#The data for the bar chart
$data0 = array(100, 125, 245, 147, 67);
$data1 = array(85, 156, 179, 211, 123);
$data2 = array(97, 87, 56, 267, 157);
#The labels for the bar chart
$labels = array("Mon", "Tue", "Wed", "Thu", "Fri");
#Create a XYChart object of size 500 x 320 pixels
$c = new XYChart(500, 320);
#Set the plotarea at (100, 40) and of size 280 x 240 pixels
$c->setPlotArea(100, 40, 280, 240);
#Add a legend box at (405, 100)
$c->addLegend(405, 100);
#Add a title to the chart
$c->addTitle("Weekday Network Load");
#Add a title to the y axis. Draw the title upright (font angle = 0)
$titleObj = $c->yAxis->setTitle("Average\nWorkload\n(MBytes\nPer Hour)");
$titleObj->setFontAngle(0);
#Set the labels on the x axis
$c->xAxis->setLabels($labels);
#Add three bar layers, each representing one data set. The bars are drawn in
#semi-transparent colors.
$c->addBarLayer($data0, 0x808080ff, "Server # 1", 5);
$c->addBarLayer($data1, 0x80ff0000, "Server # 2", 5);
$c->addBarLayer($data2, 0x8000ff00, "Server # 3", 5);
#output the chart
header("Content-type: image/png");
print($c->makeChart2(PNG));
?> |