ChartDirector supports a special pre-defined constant
NoValue for specifying missing data points.
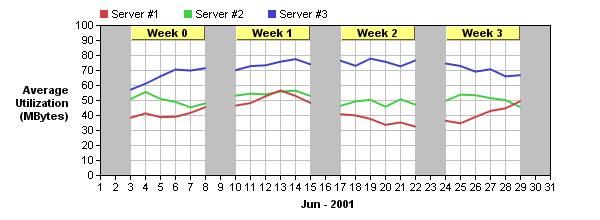
In line charts,
NoValue data points are handling by jumping over the
NoValue point - that is, directly connecting the previous data point to the next data point.
The line color and style for jumping over
NoValue data points can be different from the normal line color. The default is
Transparent, so the jump over line will be invisible. Therefore, the
NoValue point will result in a discontinuous line.
You can modify the jump over line color and style by using
LineLayer.setGapColor.
If you want the jump over line to be the same color as the normal line, use
SameAsMainColor as the jump over line color.
A common presentation style is to represent jump over lines as dash lines. This can be achieved by using a dash line color (created with
BaseChart.dashLineColor) as the jump over line color.
In addition to handing of
NoValue, this example illustrates create vertical zones and custom text boxes at dynamically determined coordinates.
The vertical zones are created using
Axis.addZone.
The custom text boxes that label weeks are created using
BaseChart.addText, with their coordinates are obtained dynamically using
Layer.getXCoor.
Note that
BaseChart.layout needs to be invoked first to auto-scale and finalize the axes, before calling
Layer.getXCoor.
[File: phpdemo/discontline.php".]
| <?php
require_once("../lib/phpchartdir.php");
#===================================================================
# For demo purpose, use random numbers as data for the chart
#===================================================================
#Use a random table to create the data. The random table contains 4 cols x 31
#rows, using 9 as seed.
$rantable = new RanTable(9, 4, 31);
#Set the 1st col to be the series 1, 2, 3, ....
$rantable->setCol(0, 1, 1, 1);
#Set the 2nd, 3rd and 4th col to be random number starting from 40, 50 and 60.
#The change between rows is set to -5 to 5. The minimum value of any cell is 0.
$rantable->setCol(1, 40, -5, 5, 0);
$rantable->setCol(2, 50, -5, 5, 0);
$rantable->setCol(3, 60, -5, 5, 0);
#Use the 1st col as the axis label
$labels = $rantable->getCol(0);
#Use the 2nd, 3rd and 4th columns for 3 lines
$data0 = $rantable->getCol(1);
$data1 = $rantable->getCol(2);
$data2 = $rantable->getCol(3);
#Simulate some data points have no data value
for($i = 1; $i < 30; $i += 7) {
$data0[$i] = NoValue;
$data1[$i] = NoValue;
$data2[$i] = NoValue;
}
#===================================================================
# Now we have the data ready. Actually drawing the chart.
#===================================================================
#Create a XYChart object of size 600 x 220 pixels
$c = new XYChart(600, 220);
#Set the plot area at (100, 25) and of size 450 x 150 pixels. Enabled both
#vertical and horizontal grids by setting their colors to light grey (0xc0c0c0)
$plotAreaObj = $c->setPlotArea(100, 25, 450, 150);
$plotAreaObj->setGridColor(0xc0c0c0, 0xc0c0c0);
#Add a legend box (92, 0) (top of plot area) using horizontal layout. Use 8 pts
#Arial font. Disable bounding box (set border to transparent).
$legendObj = $c->addLegend(92, 0, false, "", 8);
$legendObj->setBackground(Transparent);
#Add a title to the y axis. Draw the title upright (font angle = 0)
$titleObj = $c->yAxis->setTitle("Average\nUtilization\n(MBytes)");
$titleObj->setFontAngle(0);
#Use manually scaling of y axis from 0 to 100, with ticks every 10 units
$c->yAxis->setLinearScale(0, 100, 10);
#Set the labels on the x axis
$c->xAxis->setLabels2($labels);
#Set the title on the x axis
$c->xAxis->setTitle("Jun - 2001");
#Add x axis (vertical) zones to indicate Saturdays and Sundays
for($i = 0; $i < 29; $i += 7) {
$c->xAxis->addZone($i, $i + 2, 0xc0c0c0);
}
#Add a line layer to the chart
$layer = $c->addLineLayer();
#Set the default line width to 2 pixels
$layer->setLineWidth(2);
#Add the three data sets to the line layer
$layer->addDataSet($data0, 0xcf4040, "Server #1");
$layer->addDataSet($data1, 0x40cf40, "Server #2");
$layer->addDataSet($data2, 0x4040cf, "Server #3");
#Layout the chart to fix the y axis scaling. We can then use getXCoor and
#getYCoor to determine the position of custom objects.
$c->layout();
#Add the "week n" custom text boxes at the top of the plot area.
for($i = 0; $i < 4; ++$i) {
#Add the "week n" text box using 8 pt Arial font with top center alignment.
$textbox = $c->addText($layer->getXCoor($i * 7 + 2), 25, "Week $i",
"arialbd.ttf", 8, 0x0, TopCenter);
#Set the box width to cover five days
$textbox->setSize($layer->getXCoor($i * 7 + 7) - $layer->getXCoor($i * 7 + 2
) + 1, 0);
#Set box background to pale yellow 0xffff80, with a 1 pixel 3D border
$textbox->setBackground(0xffff80, Transparent, 1);
}
#output the chart
header("Content-type: image/png");
print($c->makeChart2(PNG));
?> |
© 2004 Advanced Software Engineering Limited. All rights reserved.