| <?php
require_once("../lib/phpchartdir.php");
#The data for the chart
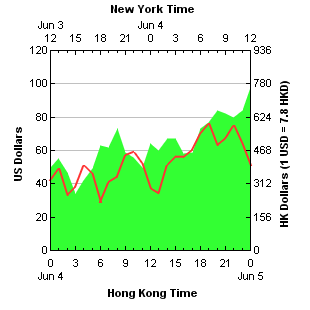
$data0 = array(42, 49, 33, 38, 51, 46, 29, 41, 44, 57, 59, 52, 37, 34, 51, 56,
56, 60, 70, 76, 63, 67, 75, 64, 51);
$data1 = array(50, 55, 47, 34, 42, 49, 63, 62, 73, 59, 56, 50, 64, 60, 67, 67,
58, 59, 73, 77, 84, 82, 80, 84, 98);
#The labels for the bottom x axis. Note the "-" means a minor tick.
$label0 = array("0\nJun 4", "-", "-", "3", "-", "-", "6", "-", "-", "9", "-",
"-", "12", "-", "-", "15", "-", "-", "18", "-", "-", "21", "-", "-",
"0\nJun 5");
#The labels for the top x axis. Note that "-" means a minor tick.
$label1 = array("Jun 3\n12", "-", "-", "15", "-", "-", "18", "-", "-", "21",
"-", "-", "Jun 4\n0", "-", "-", "3", "-", "-", "6", "-", "-", "9", "-", "-",
"12");
#Create a XYChart object of size 310 x 310 pixels
$c = new XYChart(310, 310);
#Set the plotarea at (50, 50) and of size 200 x 200 pixels
$c->setPlotArea(50, 50, 200, 200);
#Add a title to the primary (left) y axis
$c->yAxis->setTitle("US Dollars");
#Set the tick length to -4 pixels (-ve means ticks inside the plot area)
$c->yAxis->setTickLength(-4);
#Add a title to the secondary (right) y axis
$yAxis2Obj = $c->yAxis2();
$yAxis2Obj->setTitle("HK Dollars (1 USD = 7.8 HKD)");
#Set the tick length to -4 pixels (-ve means ticks inside the plot area)
$yAxis2Obj = $c->yAxis2();
$yAxis2Obj->setTickLength(-4);
#Synchronize the y-axis such that y2 = 7.8 x y1
$c->syncYAxis(7.8);
#Add a title to the bottom x axis
$c->xAxis->setTitle("Hong Kong Time");
#Set the x axis labels using the given labels
$c->xAxis->setLabels($label0);
#Set the major tick length to -4 pixels and minor tick length to -2 pixels (-ve
#means ticks inside the plot area)
$c->xAxis->setTickLength2(-4, -2);
#Set the distance between the axis labels and the axis to 6 pixels
$c->xAxis->setLabelGap(6);
#Add a title to the top x-axis
$xAxis2Obj = $c->xAxis2();
$xAxis2Obj->setTitle("New York Time");
#Set the x-axis labels using the given labels
$xAxis2Obj = $c->xAxis2();
$xAxis2Obj->setLabels($label1);
#Set the major tick length to -4 pixels and minor tick length to -2 pixels (-ve
#means ticks inside the plot area)
$xAxis2Obj = $c->xAxis2();
$xAxis2Obj->setTickLength2(-4, -2);
#Set the distance between the axis labels and the axis to 6 pixels
$xAxis2Obj = $c->xAxis2();
$xAxis2Obj->setLabelGap(6);
#Add a line layer to the chart with a line width of 2 pixels
$lineLayerObj = $c->addLineLayer($data0, -1, "Red Transactions");
$lineLayerObj->setLineWidth(2);
#Add an area layer to the chart with no area boundary line
$areaLayerObj = $c->addAreaLayer($data1, -1, "Green Transactions");
$areaLayerObj->setLineWidth(0);
#output the chart
header("Content-type: image/png");
print($c->makeChart2(PNG));
?> |