| <?php
require_once("../lib/phpchartdir.php");
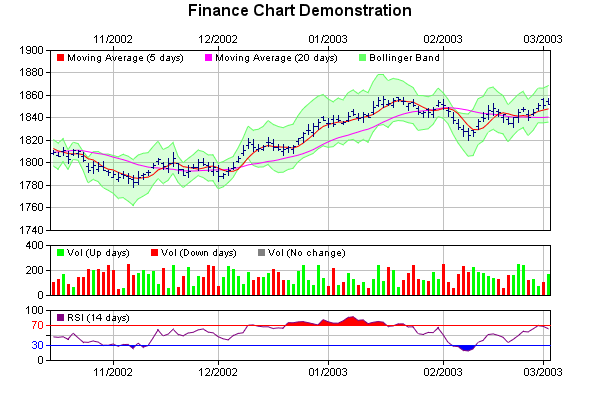
#Create a finance chart demo containing 100 days of data
$noOfDays = 100;
#To compute moving averages, we need to get data points before the first day
$extraDays = 30;
#We use a random table to simulate the data from a database. The random table
#contains 6 cols x (noOfDays + extraDays) rows, using 9 as the seed.
$rantable = new RanTable(9, 6, $noOfDays + $extraDays);
#Set the 1st col to be the timeStamp, starting from Sep 4, 2002, with each row
#representing one day, and counting week days only (jump over Sat and Sun)
$rantable->setDateCol(0, chartTime(2002, 9, 4), 86400, true);
#Set the 2nd, 3rd, 4th and 5th columns to be high, low, open and close data. The
#open value starts from 1800, and the daily change is random from -5 to 5.
$rantable->setHLOCCols(1, 1800, -5, 5);
#Set the 6th column as the vol data from 50 to 250
$rantable->setCol(5, 50, 250);
#Now we read the data from the table into arrays
$timeStamps = $rantable->getCol(0);
$highData = $rantable->getCol(1);
$lowData = $rantable->getCol(2);
$openData = $rantable->getCol(3);
$closeData = $rantable->getCol(4);
$volData = $rantable->getCol(5);
#To create the date labels for the x axis, we need to trim extraDays at the
#beginning. Also, we select only the dates that represent the first date in the
#month as labels.
$selectDates = new ArrayMath($timeStamps);
$selectDates->selectStartOfMonth();
$labels = array_slice($selectDates->result(), $extraDays);
#Similarly, for the volume data, we need to trim extraDays at the beginning
$volData = array_slice($volData, $extraDays);
#==========================================================================
# Create the top chart
#==========================================================================
#Create a XYChart object of size 600 x 210 pixels
$c = new XYChart(600, 210, Transparent);
#Set the plotarea at (50, 20) and of size 500 x 180 pixels. Enable both the
#horizontal and vertical grids by setting their colors to grey (0xc0c0c0)
$plotAreaObj = $c->setPlotArea(50, 20, 500, 180);
$plotAreaObj->setGridColor(0xc0c0c0, 0xc0c0c0);
#Add a horizontal legend box at (50, 15) and set its border and background
#colors to transparent
$legendObj = $c->addLegend(50, 15, false, "arial.ttf", 7.5);
$legendObj->setBackground(Transparent);
#Add an HLOC layer using blue (0x80) color. We need to trim extraDays at the
#beginning as these days are just for computing moving averages.
$c->addHLOCLayer(array_slice($highData, $extraDays), array_slice($lowData,
$extraDays), array_slice($openData, $extraDays), array_slice($closeData,
$extraDays), 0x80);
#Add line layers representing 5 days and 20 days moving averages.
$movAvgLine1 = new ArrayMath($closeData);
$movAvgLine1->movAvg(5);
$movAvgLine2 = new ArrayMath($closeData);
$movAvgLine2->movAvg(20);
$c->addLineLayer(array_slice($movAvgLine1->result(), $extraDays), 0xff0000,
"Moving Average (5 days)");
$c->addLineLayer(array_slice($movAvgLine2->result(), $extraDays), 0xff00ff,
"Moving Average (20 days)");
#Compute Bollinger Band as closeData +/- 2 * standard_deviation
$stdDev2 = new ArrayMath($closeData);
$stdDev2->movStdDev(20);
$stdDev2->mul(2);
$upperBand = new ArrayMath($closeData);
$upperBand->add($stdDev2->result());
$lowerBand = new ArrayMath($closeData);
$lowerBand->sub($stdDev2->result());
#Add the upper and lower lines for the bollinger band
$uLayer = $c->addLineLayer(array_slice($upperBand->result(), $extraDays),
0x66ff66, "Bollinger Band");
$lLayer = $c->addLineLayer(array_slice($lowerBand->result(), $extraDays),
0x66ff66);
#Color the region between the bollinger lines with semi-transparent green
$c->addInterLineLayer($uLayer->getLine(), $lLayer->getLine(), 0xc066ff66);
#Add labels to the x axis formatted as mm/yyyy
$c->xAxis->setLabels2($labels, "{value|mm/yyyy}");
#For the top chart, the x axis is on top
$c->setXAxisOnTop();
#==========================================================================
# Create the middle chart (volume chart)
#==========================================================================
#Create a XYChart object of size 600 x 80 pixels
$c2 = new XYChart(600, 80, Transparent);
#Set the plotarea at (50, 10) and of size 500 x 50) pixels. Enable both the
#horizontal and vertical grids by setting their colors to grey (0xc0c0c0)
$plotAreaObj = $c2->setPlotArea(50, 10, 500, 50);
$plotAreaObj->setGridColor(0xc0c0c0, 0xc0c0c0);
#Add a horizontal legend box at (50, 5) and set its border and background colors
#to transparent
$legendObj = $c2->addLegend(50, 5, false, "arial.ttf", 7.5);
$legendObj->setBackground(Transparent);
#Compute an array to represent the closing price changes
$closeChange = new ArrayMath($closeData);
$closeChange->delta();
$closeChange = array_slice($closeChange->result(), $extraDays);
#Select the volume data for "up" days. An up day is a day where the closing
#price is higher than the preivous day. Use the selected data for a green bar
#layer.
$upVol = new ArrayMath($volData);
$upVol->selectGTZ($closeChange);
$barLayerObj = $c2->addBarLayer($upVol->result(), 0xff00, "Vol (Up day)");
$barLayerObj->setBorderColor(Transparent);
#Select the volume data for "down" days. An up day is a day where the closing
#price is lower than the preivous day. Use the selected data for a red bar
#layer.
$downVol = new ArrayMath($volData);
$downVol->selectLTZ($closeChange);
$barLayerObj = $c2->addBarLayer($downVol->result(), 0xff0000, "Vol (Down day)");
$barLayerObj->setBorderColor(Transparent);
#Select the volume data for days when closing prices are unchanged. Use the
#selected data for a grey bar layer.
$equalVol = new ArrayMath($volData);
$equalVol->selectEQZ($closeChange);
$barLayerObj = $c2->addBarLayer($equalVol->result(), 0x808080, "Vol (No change)"
);
$barLayerObj->setBorderColor(Transparent);
#Add labels to the x axis. We do not really need the label text, so we set them
#to transparent. We need the grid line associated the labels.
$c2->xAxis->setLabels2($labels);
$c2->xAxis->setColors(LineColor, Transparent);
#==========================================================================
# Create the bottom chart (RSI chart)
#==========================================================================
#Create a XYChart object of size 600 x 120 pixels
$c3 = new XYChart(600, 120, Transparent);
#Set the plotarea at (50, 10) and of size 500 x 50) pixels. Enable both the
#horizontal and vertical grids by setting their colors to grey (0xc0c0c0)
$plotAreaObj = $c3->setPlotArea(50, 10, 500, 50);
$plotAreaObj->setGridColor(0xc0c0c0, 0xc0c0c0);
#Add a horizontal legend box at (50, 5) and set its border and background colors
#to transparent
$legendObj = $c3->addLegend(50, 5, false, "arial.ttf", 7.5);
$legendObj->setBackground(Transparent);
#RSI is defined as the average up changes for the last 14 days, divided by the
#average absolute changes for the last 14 days, expressed as a percentage.
#Use the delta method to get the changes between subsequent days, then use
#selectGTZ to get the up days only, and compute the 14 days moving average
$upChange = new ArrayMath($closeData);
$upChange->delta();
$upChange->selectGTZ();
$upChange->movAvg(14);
#Similar, compute the 14 days moving average of the absolute changes
$absChange = new ArrayMath($closeData);
$absChange->delta();
$absChange->abs();
$absChange->movAvg(14);
#Compute RSI as the ratio of the above two moving averages, expressed as
#percentage
$rsi = new ArrayMath($upChange->result());
$rsi->div($absChange->result());
$rsi->mul(100);
#Add RSI as a line layer
$rsiLine = $c3->addLineLayer(array_slice($rsi->result(), $extraDays), 0x800080,
"RSI (14 days)");
#Add a blue (0xff) mark at 30
$mark30 = $c3->yAxis->addMark(30, 0xff, "30");
#Add a red (0xff0000) mark at 70
$mark70 = $c3->yAxis->addMark(70, 0xff0000, "70");
#If the RSI line gets above the upper mark line, color the region between the
#lines as red (0xff0000)
$c3->addInterLineLayer($rsiLine->getLine(), $mark70->getLine(), 0xff0000,
Transparent);
#If the RSI line gets below the lower mark line, color the region between the
#lines as blue (0xff)
$c3->addInterLineLayer($rsiLine->getLine(), $mark30->getLine(), Transparent,
0xff);
#Set the y axis scale as 0 - 100, with tick at 50
$c3->yAxis->setLinearScale(0, 100, 50);
#We need to explicitly set the indent mode axis. By default, line layers are not
#indented, but we need it to be indented so the x axis will synchronize with the
#top and middle charts
$c3->xAxis->setIndent(true);
#Add labels to the x axis formatted as mm/yyyy
$c3->xAxis->setLabels2($labels, "{value|mm/yyyy}");
#==========================================================================
# Combine the charts together using a MultiChart
#==========================================================================
#Create a MultiChart object of size 600 x 400 pixels
$m = new MultiChart(600, 400);
#Add a title to the chart
$m->addTitle("Finance Chart Demonstration");
#Add the 3 charts to the multi-chart
$m->addChart(0, 30, $c);
$m->addChart(0, 235, $c2);
$m->addChart(0, 300, $c3);
#output the chart
header("Content-type: image/png");
print($m->makeChart2(PNG));
?> |