| <?php
require_once("../lib/phpchartdir.php");
#The data for the chart
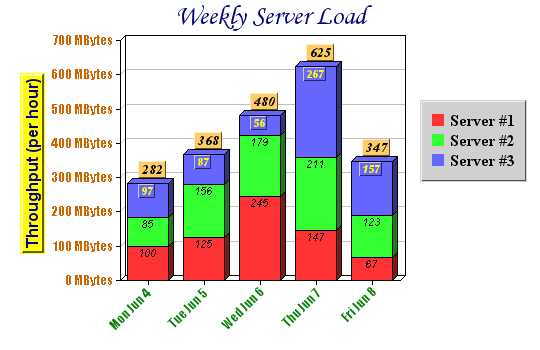
$data0 = array(100, 125, 245, 147, 67);
$data1 = array(85, 156, 179, 211, 123);
$data2 = array(97, 87, 56, 267, 157);
$labels = array("Mon Jun 4", "Tue Jun 5", "Wed Jun 6", "Thu Jun 7", "Fri Jun 8")
;
#Create a XYChart object of size 540 x 350 pixels
$c = new XYChart(540, 350);
#Set the plot area to start at (120, 40) and of size 280 x 240 pixels
$c->setPlotArea(120, 40, 280, 240);
#Add a title to the chart using 20 pts Monotype Corsiva (mtcorsva.ttf) font and
#using a deep blue color (0x000080)
$c->addTitle("Weekly Server Load", "mtcorsva.ttf", 20, 0x80);
#Add a legend box at (420, 100) (right of plot area) using 12 pts Times Bold
#font. Sets the background of the legend box to light grey 0xd0d0d0 with a 1
#pixel 3D border.
$legendObj = $c->addLegend(420, 100, true, "timesbd.ttf", 12);
$legendObj->setBackground(0xd0d0d0, 0xd0d0d0, 1);
#Add a title to the y-axis using 12 pts Arial Bold/deep blue (0x000080) font.
#Set the background to yellow (0xffff00) with a 2 pixel 3D border.
$titleObj = $c->yAxis->setTitle("Throughput (per hour)", "arialbd.ttf", 12, 0x80
);
$titleObj->setBackground(0xffff00, 0xffff00, 2);
#Use 10 pts Impact/orange (0xcc6600) font for the y axis labels
$c->yAxis->setLabelStyle("impact.ttf", 10, 0xcc6600);
#Set the axis label format to "nnn MBytes"
$c->yAxis->setLabelFormat("{value} MBytes");
#Use 10 pts Impact/green (0x008000) font for the x axis labels. Set the label
#angle to 45 degrees.
$labelStyleObj = $c->xAxis->setLabelStyle("impact.ttf", 10, 0x8000);
$labelStyleObj->setFontAngle(45);
#Set the x axis labels using the given labels
$c->xAxis->setLabels($labels);
#Add a 3D stack bar layer with a 3D depth of 5 pixels
$layer = $c->addBarLayer2(Stack, 5);
#Use Arial Italic as the default data label font in the bars
$layer->setDataLabelStyle("ariali.ttf");
#Use 10 pts Times Bold Italic (timesbi.ttf) as the aggregate label font. Set the
#background to flesh (0xffcc66) color with a 1 pixel 3D border.
$aggregateLabelStyleObj = $layer->setAggregateLabelStyle("timesbi.ttf", 10);
$aggregateLabelStyleObj->setBackground(0xffcc66, Transparent, 1);
#Add the first data set to the stacked bar layer
$layer->addDataSet($data0, -1, "Server #1");
#Add the second data set to the stacked bar layer
$layer->addDataSet($data1, -1, "Server #2");
#Add the third data set to the stacked bar layer, and set its data label font to
#Arial Bold Italic.
$dataSetObj = $layer->addDataSet($data2, -1, "Server #3");
$textbox = $dataSetObj->setDataLabelStyle("arialbi.ttf");
#Set the data label font color for the third data set to yellow (0xffff00)
$textbox->setFontColor(0xffff00);
#Set the data label background color to the same color as the bar segment, with
#a 1 pixel 3D border.
$textbox->setBackground(SameAsMainColor, Transparent, 1);
#output the chart
header("Content-type: image/png");
print($c->makeChart2(PNG));
?> |