| <?php
require_once("../lib/phpchartdir.php");
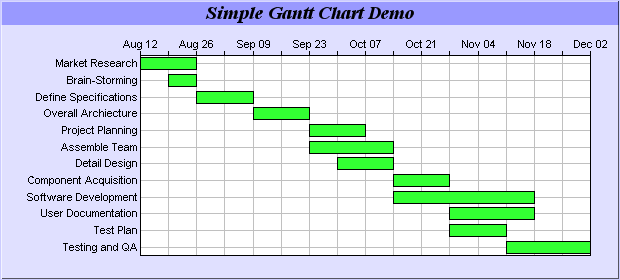
#data for the gantt chart, representing the start date, end date and names for
#various activities
$startDate = array(chartTime(2002, 8, 12), chartTime(2002, 8, 19), chartTime(
2002, 8, 26), chartTime(2002, 9, 9), chartTime(2002, 9, 23), chartTime(2002,
9, 23), chartTime(2002, 9, 30), chartTime(2002, 10, 14), chartTime(2002, 10,
14), chartTime(2002, 10, 28), chartTime(2002, 10, 28), chartTime(2002, 11,
11));
$endDate = array(chartTime(2002, 8, 26), chartTime(2002, 8, 26), chartTime(2002,
9, 9), chartTime(2002, 9, 23), chartTime(2002, 10, 7), chartTime(2002, 10,
14), chartTime(2002, 10, 14), chartTime(2002, 10, 28), chartTime(2002, 11,
18), chartTime(2002, 11, 18), chartTime(2002, 11, 11), chartTime(2002, 12, 2
));
$labels = array("Market Research", "Brain-Storming", "Define Specifications",
"Overall Archiecture", "Project Planning", "Assemble Team", "Detail Design",
"Component Acquisition", "Software Development", "User Documentation",
"Test Plan", "Testing and QA");
#Create a XYChart object of size 620 x 280 pixels. Set background color
#0xe0e0ff, border color to 0xccccff, with 1 pixel 3D border effect.
$c = new XYChart(620, 280, 0xe0e0ff, 0xccccff, 1);
#Set the plotarea at (140, 55) and of size 450 x 200 pixels. Use a white
#background. Enable both horizontal and vertical grids by setting their colors
#to grey (0xc0c0c0)
$c->setPlotArea(140, 55, 450, 200, 0xffffff, -1, LineColor, 0xc0c0c0, 0xc0c0c0);
#swap the x and y axes to create a horziontal box-whisker chart
$c->swapXY();
#Add a horizontal legend box at (300, 300) using 8pt Arial Bold Italic as font
$legendBox = $c->addLegend(300, 300, false, "arialbi.ttf", 8);
#Top center alignment the legend box to (300, 300)
$legendBox->setAlignment(TopCenter);
#Set the width of the legend box to 500 pixels (height = automatic)
$legendBox->setSize(500, 0);
#Set the legend box background and border colors to transparent
$legendBox->setBackground(Transparent, Transparent);
#Add a title to the chart using 14 points Times Bold Itatic font, with a pale
#blue (0x9999ff) background
$titleObj = $c->addTitle("Simple Gantt Chart Demo", "timesbi.ttf", 14);
$titleObj->setBackground(0x9999ff);
#Set the y-axis scale to be date scale from Aug 12, 2002 to Dec 2, 2002, with
#ticks every 7 days (1 week)
$c->yAxis->setDateScale(chartTime(2002, 8, 12), chartTime(2002, 12, 2), 86400 *
7);
#Set the label format to show month and day only.
$c->yAxis->setLabelFormat("{value|mmm dd}");
#Set the y-axis to shown on the top (right + swapXY = top)
$c->setYAxisOnRight();
#Set the labels on the x axis
$c->xAxis->setLabels($labels);
#Reverse the x-axis scale so that it points downwards.
$c->xAxis->setReverse();
#Disable ticks on x-axis by setting their length to 0.
$c->xAxis->setTickLength(0);
#Add a green (0x33ff33) box-whisker layer showing the box only
$c->addBoxWhiskerLayer($startDate, $endDate, null, null, null, 0x33ff33);
#output the chart
header("Content-type: image/png");
print($c->makeChart2(PNG));
?> |