| <?php
require_once("../lib/phpchartdir.php");
#The data for the bar chart
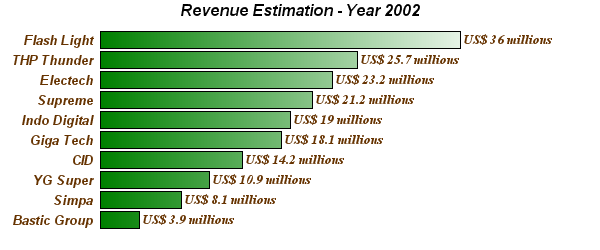
$data = array(3.9, 8.1, 10.9, 14.2, 18.1, 19.0, 21.2, 23.2, 25.7, 36);
#The labels for the bar chart
$labels = array("Bastic Group", "Simpa", "YG Super", "CID", "Giga Tech",
"Indo Digital", "Supreme", "Electech", "THP Thunder", "Flash Light");
#Create a XYChart object of size 600 x 250 pixels
$c = new XYChart(600, 250);
#Add a title to the chart using Arial Bold Italic font
$c->addTitle("Revenue Estimation - Year 2002", "arialbi.ttf");
#Set the plotarea at (100, 30) and of size 400 x 200 pixels. Set the plotarea
#border, background and grid lines to Transparent
$c->setPlotArea(100, 30, 400, 200, Transparent, Transparent, Transparent,
Transparent, Transparent);
#Add a bar chart layer using the given data. Use a gradient color for the bars,
#where the gradient is from dark green (0x008000) to white (0xffffff)
$layer = $c->addBarLayer($data, $c->gradientColor(100, 0, 500, 0, 0x8000,
0xffffff));
#Swap the axis so that the bars are drawn horizontally
$c->swapXY(true);
#Set the bar gap to 10%
$layer->setBarGap(0.1);
#Use the format "US$ xxx millions" as the bar label
$layer->setAggregateLabelFormat("US\$ {value} millions");
#Set the bar label font to 10 pts Times Bold Italic/dark red (0x663300)
$layer->setAggregateLabelStyle("timesbi.ttf", 10, 0x663300);
#Set the labels on the x axis
$textbox = $c->xAxis->setLabels($labels);
#Set the x axis label font to 10pt Arial Bold Italic
$textbox->setFontStyle("arialbi.ttf");
$textbox->setFontSize(10);
#Set the x axis to Transparent, with labels in dark red (0x663300)
$c->xAxis->setColors(Transparent, 0x663300);
#Set the y axis and labels to Transparent
$c->yAxis->setColors(Transparent, Transparent);
#output the chart
header("Content-type: image/png");
print($c->makeChart2(PNG));
?> |