This example demonstrates using
CDML and and
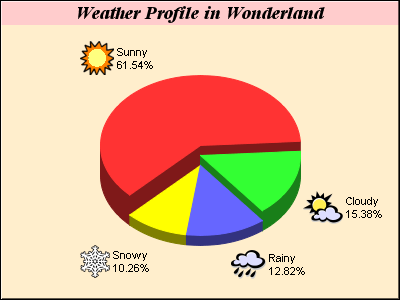
parameter substitution to include icons in sector labels.
- The icons file names are added to the chart as an extra field using PieChart.addExtraField.
- The sector label format is designed to include the icon on the left, and a text block containing the text label and percentages in two lines on the the right. The format is represented using CDML, with the fields represented using parameter substitution.
- The sector label format is set into the pie chart using PieChart.setLabelFormat.
- The search path to load the icon images is configured to be the same as the script directory using BaseChart.setSearchPath. This is needed in IIS because the current directory in IIS is the directory of the IIS executable, not the script directory.
[File: phpdemo/iconpie.php".]
| <?php
require_once("../lib/phpchartdir.php");
#The data for the pie chart
$data = array(72, 18, 15, 12);
#The depths for the sectors
$depths = array(30, 20, 10, 10);
#The labels for the pie chart
$labels = array("Sunny", "Cloudy", "Rainy", "Snowy");
#The icons for the sectors
$icons = array("sun.png", "cloud.png", "rain.png", "snowy.png");
#Create a PieChart object of size 400 x 300 pixels, with 0xffeecc as the
#background color, a black border, and 1 pixel 3D border effect
$c = new PieChart(400, 300, 0xffeecc, 0, 1);
#Set directory for loading images to current script directory
#Need when running under Microsoft IIS
$c->setSearchPath(dirname(__FILE__));
#Set the center of the pie at (200, 175) and the radius to 100 pixels
$c->setPieSize(200, 175, 100);
#Add a title box using Times Bold Italic/14 points as font and 0xffcccc as
#background color
$titleObj = $c->addTitle("Weather Profile in Wonderland", "timesbi.ttf", 14);
$titleObj->setBackground(0xffcccc);
#Set the pie data and the pie labels
$c->setData($data, $labels);
#Add icons to the chart as a custom field
$c->addExtraField($icons);
#Configure the sector labels using CDML to include the icon images
$c->setLabelFormat(
"<*block,valign=absmiddle*><*img={field0}*> <*block*>{label}\n{percent}%".
"<*/*><*/*>");
#Draw the pie in 3D
$c->set3D2($depths);
#Set the start angle to 225 degrees may improve layout when the depths of the
#sector are sorted in descending order, because it ensures the tallest sector is
#at the back.
$c->setStartAngle(225);
#output the chart
header("Content-type: image/png");
print($c->makeChart2(PNG));
?> |
© 2004 Advanced Software Engineering Limited. All rights reserved.