This example demonstrates using ChartDirector image maps to invoke client side
Javascript functions.
In this example, a clickable area chart will be produced. Apart from responding
to mouse clicks, detail information about the data points will be displayed in
separate dynamic HTML blocks when the mouse pointer moves over the chart. This
is accomplished using "onMouseOver" and "onMouseOut" event handlers with client
side Javascript.
The code for this example is listed below.
[File: phpdemo/jsarea.php".]
| <?php
require_once("../lib/phpchartdir.php");
#
#For demo purpose, we use hard coded data. In real life, the following data
#could come from a database.
#
$revenue = array(4500, 5600, 6300, 8000, 12000, 14000, 16000, 20000, 24000,
28000);
$grossMargin = array(62, 65, 63, 60, 55, 56, 57, 53, 52, 50);
$backLog = array(563, 683, 788, 941, 1334, 1522, 1644, 1905, 2222, 2544);
$receviable = array(750, 840, 860, 1200, 2200, 2700, 2800, 3900, 4900, 6000);
$labels = array("1992", "1993", "1994", "1995", "1996", "1997", "1998", "1999",
"2000", "2001");
#Create a XYChart object of size 440 x 200 pixels
$c = new XYChart(440, 200);
#Add a title to the chart using Times Bold Italic font
$c->addTitle("Annual Revenue for Star Tech", "timesbi.ttf");
#Set the plotarea at (60, 5) and of size 350 x 150 pixels
$c->setPlotArea(60, 25, 350, 150);
#Add an area chart layer for the revenue data
$areaLayerObj = $c->addAreaLayer($revenue, 0x3333cc, "Revenue");
$areaLayerObj->setBorderColor(SameAsMainColor);
#Set the x axis labels using the given labels
$c->xAxis->setLabels($labels);
#Add a title to the y axis
$c->yAxis->setTitle("USD (K)");
#Create the image and save it in a temporary location
$chart1URL = $c->makeSession("chart1");
#Client side Javascript to show detail information "onmouseover"
$showText = "onmouseover='setDIV(\"info{x}\", \"visible\");' ";
#Client side Javascript to hide detail information "onmouseout"
$hideText = "onmouseout='setDIV(\"info{x}\", \"hidden\");' ";
#"title" attribute to show tool tip
$toolTip = "title='{xLabel}: USD {value|0}K'";
#Create an image map for the chart
$imageMap = $c->getHTMLImageMap("xystub.php", "", "$showText$hideText$toolTip");
?>
<html>
<body>
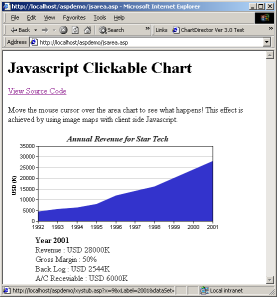
<h1>Javascript Clickable Chart</h1>
<p><a href="viewsource.php?file=<?php echo $HTTP_SERVER_VARS["SCRIPT_NAME"]?>">
View Source Code
</a></p>
<p style="width:500px">
Move the mouse cursor over the area chart to see what happens!
This effect is achieved by using image maps with client side Javascript.
</p>
<img src="myimage.php?<?php echo $chart1URL?>" border="0" usemap="#map1">
<map name="map1">
<?php echo $imageMap?>
</map>
<br>
<!-----------------------------------------------------
Create the DIV layers to show detail information
-------------------------------------------------------->
<?php for($i = 0; $i < count($revenue); ++$i) {?>
<div id="info<?php echo $i?>"
style="visibility:hidden;position:absolute;left:65px;">
<b>Year <?php echo $labels[$i]?></b><br>
Revenue : USD <?php echo $revenue[$i]?>K<br>
Gross Margin : <?php echo $grossMargin[$i]?>%<br>
Back Log : USD <?php echo $backLog[$i]?>K<br>
A/C Receviable : USD <?php echo $receviable[$i]?>K<br>
</div>
<?php }?>
<!-----------------------------------------------------
Client side utility function to show and hide
a layer. Works in both IE and Netscape browsers.
-------------------------------------------------------->
<SCRIPT>
function setDIV(id, cmd) {
if (document.getElementById)
//IE 5.x or NS 6.x or above
document.getElementById(id).style.visibility = cmd;
else if (document.all)
//IE 4.x
document.all[id].style.visibility = cmd;
else
//Netscape 4.x
document[id].visibility = cmd;
}
</SCRIPT>
</body>
</html> |
In the above code, the chart is created and saved in a session
variable using
BaseChart.makeSession.
An <IMG> tag is used to retrieve the
chart with
"myimage.php?<?php echo $chart1URL?>" as the URL. "myimage.php" is a simple utility that comes with ChartDirector
for retrieving images from session variables.
The image map for the chart is created using the following code:
|
#Client side Javascript to show detail information "onmouseover"
$showText = "onmouseover='setDIV(\"info{x}\", \"visible\");' ";
#Client side Javascript to hide detail information "onmouseout"
$hideText = "onmouseout='setDIV(\"info{x}\", \"hidden\");' ";
#"title" attribute to show tool tip
$toolTip = "title='{xLabel}: USD {value|0}K'";
#Create an image map for the chart
$imageMap = $c->getHTMLImageMap("xystub.php", "", $showText.$hideText.
$toolTip);
|
Note that in additional to the "title" attribute for the "tool tip", the image
map also includes event handlers "onmouseover" and "onmouseout".
The "onmouseover" and "onmouseout" event handlers call the client side
Javascript function "setDIV". This function is a simple utility for showing and
hiding a DIV block in dynamic HTML. The source code of "setDIV" is as follows.
It is included as part of the web page to be sent to the browser.
|
<!-----------------------------------------------------
Client side utility function to show and hide
a layer. Works in both IE and Netscape browsers.
-------------------------------------------------------->
<SCRIPT>
function setDIV(id, cmd) {
if (document.getElementById)
//IE 5.x or NS 6.x or above
document.getElementById(id).style.visibility = cmd;
else if (document.all)
//IE 4.x
document.all[id].style.visibility = cmd;
else
//Netscape 4.x
document[id].visibility = cmd;
}
</SCRIPT> |
The DIV blocks that show the detail information are generated using the
following code.
|
<!-----------------------------------------------------
Create the DIV layers to show detail information
-------------------------------------------------------->
<?php for($i = 0; $i < count($revenue); ++$i) {?>
<div id="info<?php echo $i?>"
style="visibility:hidden;position:absolute;left:65px;">
<b>Year <?php echo $labels[$i]?></b><br>
Revenue : USD <?php echo $revenue[$i]?>K<br>
Gross Margin : <?php echo $grossMargin[$i]?>%<br>
Back Log : USD <?php echo $backLog[$i]?>K<br>
A/C Receviable : USD <?php echo $receviable[$i]?>K<br>
</div>
<?php }?>
|
Each data point is associated with a DIV block that shows its detail
information. The "id" attribute of the DIV block is set to "info
[i]",
where
[i] is the data point number.
Initially the DIV blocks are hidden using
"visibility:hidden"
inside the style attribute. When the mouse pointer moves over a hot spot,
the "onmouseover" event handler will execute the following code.
| setDIV("info{x}", "visible"); |
The above code uses the "setDIV" function to show the DIV block whose "id"
attribute is "info{x}", where "{x}" is the data point number associated with
the hot spot. As a result, the DIV block for that data point is shown.
Similarly, when the mouse pointer moves out of the hot spot, the "onmouseout"
event handler will execute the following code to hide the DIV block.
| setDIV("info{x}", "hidden"); |
In addition to responding to mouse over and mouse out events, the chart is also
clickable using "xystub.php" as the handler.
For demo purpose, "xystub.php" simply displays information on what is clicked.
It's source code is as follows.
[File: phpdemo/xystub.php".]
|
<html>
<body>
<h1>Simple Clickable XY Chart Handler</h1>
<p><a href="viewsource.php?file=<?php echo $HTTP_SERVER_VARS["SCRIPT_NAME"]?>">
View Source Code
</a></p>
<p><b>You have clicked on the following chart element :</b></p>
<ul>
<li>Data Set : <?php echo $HTTP_GET_VARS["dataSetName"]?></li>
<li>X Position : <?php echo $HTTP_GET_VARS["x"]?></li>
<li>X Label : <?php echo $HTTP_GET_VARS["xLabel"]?></li>
<li>Data Value : <?php echo $HTTP_GET_VARS["value"]?></li>
</ul>
</body>
</html> |
© 2004 Advanced Software Engineering Limited. All rights reserved.