| <?php
require_once("../lib/phpchartdir.php");
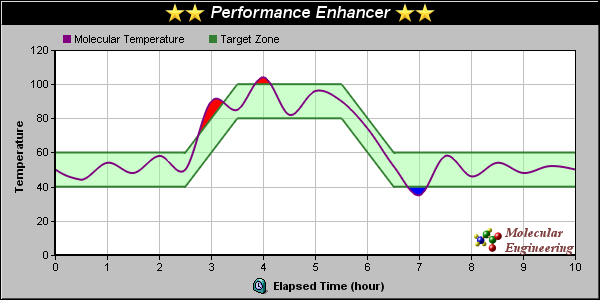
#The data for the upper and lower bounding lines
$upperY = array(60, 60, 100, 100, 60, 60);
$lowerY = array(40, 40, 80, 80, 40, 40);
$zoneX = array(0, 2.5, 3.5, 5.5, 6.5, 10);
#The data for the spline curve
$curveY = array(50, 44, 54, 48, 58, 50, 90, 85, 104, 82, 96, 90, 74, 52, 35, 58,
46, 54, 48, 52, 50);
$curveX = array(0, 0.5, 1, 1.5, 2, 2.5, 3.0, 3.5, 4, 4.5, 5, 5.5, 6, 6.5, 7,
7.5, 8, 8.5, 9, 9.5, 10);
#Create a XYChart object of size 600 x 300 pixels, with a light grey (0xc0c0c0)
#background, a black border, and 1 pixel 3D border effect.
$c = new XYChart(600, 300, 0xc0c0c0, 0, 1);
#Set directory for loading images to current script directory
#Need when running under Microsoft IIS
$c->setSearchPath(dirname(__FILE__));
#Set the plotarea at (55, 50) and of size 520 x 205 pixels, with white
#background. Turn on both horizontal and vertical grid lines with light grey
#color (0xc0c0c0)
$c->setPlotArea(55, 50, 520, 205, 0xffffff, -1, -1, 0xc0c0c0, 0xc0c0c0);
#Add a legend box at (55, 25) (top of the chart) with horizontal layout. Use 8
#pts Arial font. Set the background and border color to Transparent.
$legendObj = $c->addLegend(55, 25, false, "", 8);
$legendObj->setBackground(Transparent);
#Add a title box to the chart using 13 pts Arial Bold Italic font. The title is
#in CDML and includes embedded images for highlight. The text is white
#(0xffffff) on a black background, with a 1 pixel 3D border.
$titleObj = $c->addTitle(
"<*block,valign=absmiddle*><*img=star.png*><*img=star.png*> Performance ".
"Enhancer <*img=star.png*><*img=star.png*><*/*>", "arialbi.ttf", 13,
0xffffff);
$titleObj->setBackground(0x0, -1, 1);
#Add a title to the y axis
$c->yAxis->setTitle("Temperature");
#Add a title to the x axis using CMDL
$c->xAxis->setTitle(
"<*block,valign=absmiddle*><*img=clock.png*> Elapsed Time (hour)<*/*>");
#Set the axes width to 2 pixels
$c->xAxis->setWidth(2);
$c->yAxis->setWidth(2);
#Add a purple (0x800080) spline layer to the chart with a line width of 2 pixels
$splineLayer = $c->addSplineLayer($curveY, 0x800080, "Molecular Temperature");
$splineLayer->setXData($curveX);
$splineLayer->setLineWidth(2);
#Add a line layer to the chart with two dark green (0x338033) data sets, and a
#line width of 2 pixels
$lineLayer = $c->addLineLayer2();
$lineLayer->addDataSet($upperY, 0x338033, "Target Zone");
$lineLayer->addDataSet($lowerY, 0x338033);
$lineLayer->setXData($zoneX);
$lineLayer->setLineWidth(2);
#Color the zone between the upper zone line and lower zone line as
#semi-transparent light green (0x8099ff99)
$c->addInterLineLayer($lineLayer->getLine(0), $lineLayer->getLine(1),
0x8099ff99, 0x8099ff99);
#If the spline line gets above the upper zone line, color to area between the
#lines red (0xff0000)
$c->addInterLineLayer($splineLayer->getLine(0), $lineLayer->getLine(0),
0xff0000, Transparent);
#If the spline line gets below the lower zone line, color to area between the
#lines blue (0xff)
$c->addInterLineLayer($splineLayer->getLine(0), $lineLayer->getLine(1),
Transparent, 0xff);
#Add a custom CDML text at the bottom right of the plot area as the logo
$textObj = $c->addText(575, 255,
"<*block,valign=absmiddle*><*img=small_molecule.png*> <*block*>".
"<*font=timesbi.ttf,size=10,color=804040*>Molecular\nEngineering<*/*>");
$textObj->setAlignment(BottomRight);
#output the chart
header("Content-type: image/png");
print($c->makeChart2(PNG));
?> |