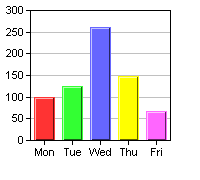
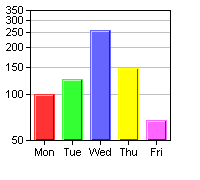
This example illustrates setting an axis to log scale using
Axis.setLogScale3.
[File: phpdemo/logaxis.php".]
| <?php
require_once("../lib/phpchartdir.php");
#The data for the chart
$data = array(100, 125, 260, 147, 67);
$labels = array("Mon", "Tue", "Wed", "Thu", "Fri");
#Create a XYChart object of size 200 x 180 pixels
$c = new XYChart(200, 180);
#Set the plot area at (30, 10) and of size 140 x 130 pixels
$c->setPlotArea(30, 10, 140, 130);
#Ise log scale axis if required
if ($HTTP_GET_VARS["img"] == "1") {
$c->yAxis->setLogScale3();
}
#Set the labels on the x axis
$c->xAxis->setLabels($labels);
#Add a color bar layer using the given data. Use a 1 pixel 3D border for the
#bars.
$barLayer3Obj = $c->addBarLayer3($data);
$barLayer3Obj->setBorderColor(-1, 1);
#output the chart
header("Content-type: image/png");
print($c->makeChart2(PNG));
?> |
© 2004 Advanced Software Engineering Limited. All rights reserved.