| <?php
require_once("../lib/phpchartdir.php");
#The data for the chart
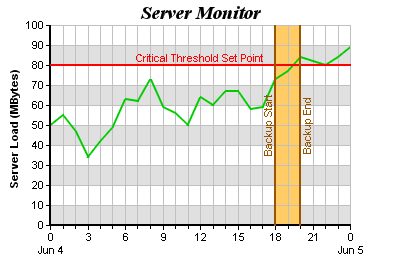
$data = array(50, 55, 47, 34, 42, 49, 63, 62, 73, 59, 56, 50, 64, 60, 67, 67,
58, 59, 73, 77, 84, 82, 80, 84, 89);
#The labels for the chart. Note the "-" means a minor tick.
$labels = array("0\nJun 4", "-", "-", "3", "-", "-", "6", "-", "-", "9", "-",
"-", "12", "-", "-", "15", "-", "-", "18", "-", "-", "21", "-", "-",
"0\nJun 5");
#Create a XYChart object of size 400 x 270 pixels
$c = new XYChart(400, 270);
#Set the plotarea at (80, 25) and of size 300 x 200 pixels. Use alternate color
#background (0xe0e0e0) and (0xffffff). Set border and grid colors to grey
#(0xc0c0c0).
$c->setPlotArea(50, 25, 300, 200, 0xe0e0e0, 0xffffff, 0xc0c0c0, 0xc0c0c0,
0xc0c0c0);
#Add a title to the chart using 14 pts Times Bold Italic font
$c->addTitle("Server Monitor", "timesbi.ttf", 14);
#Add a title to the y axis
$c->yAxis->setTitle("Server Load (MBytes)");
#Set the y axis width to 2 pixels
$c->yAxis->setWidth(2);
#Set the labels on the x axis
$c->xAxis->setLabels($labels);
#Set the x axis width to 2 pixels
$c->xAxis->setWidth(2);
#Add a horizontal red (0x800080) mark line at y = 80
$yMark = $c->yAxis->addMark(80, 0xff0000, "Critical Threshold Set Point");
#Set the mark line width to 2 pixels
$yMark->setLineWidth(2);
#Put the mark label at the top center of the mark line
$yMark->setAlignment(TopCenter);
#Add an orange (0xffcc66) zone from x = 18 to x = 20
$c->xAxis->addZone(18, 20, 0xffcc66);
#Add a vertical brown (0x995500) mark line at x = 18
$xMark1 = $c->xAxis->addMark(18, 0x995500, "Backup Start");
#Set the mark line width to 2 pixels
$xMark1->setLineWidth(2);
#Put the mark label at the left of the mark line
$xMark1->setAlignment(Left);
#Rotate the mark label by 90 degrees so it draws vertically
$xMark1->setFontAngle(90);
#Add a vertical brown (0x995500) mark line at x = 20
$xMark2 = $c->xAxis->addMark(20, 0x995500, "Backup End");
#Set the mark line width to 2 pixels
$xMark2->setLineWidth(2);
#Put the mark label at the right of the mark line
$xMark2->setAlignment(Right);
#Rotate the mark label by 90 degrees so it draws vertically
$xMark2->setFontAngle(90);
#Add a green (0x00cc00) line layer with line width of 2 pixels
$lineLayerObj = $c->addLineLayer($data, 0xcc00);
$lineLayerObj->setLineWidth(2);
#output the chart
header("Content-type: image/png");
print($c->makeChart2(PNG));
?> |