| <?php
require_once("../lib/phpchartdir.php");
#The data for the bar chart
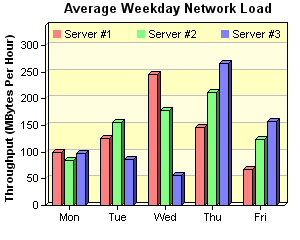
$data0 = array(100, 125, 245, 147, 67);
$data1 = array(85, 156, 179, 211, 123);
$data2 = array(97, 87, 56, 267, 157);
$labels = array("Mon", "Tue", "Wed", "Thu", "Fri");
#Create a XYChart object of size 300 x 240 pixels
$c = new XYChart(300, 240);
#Add a title to the chart using 10 pt Arial font
$c->addTitle(" Average Weekday Network Load", "", 10);
#Set the plot area at (45, 25) and of size 239 x 180. Use two alternative
#background colors (0xffffc0 and 0xffffe0)
$plotAreaObj = $c->setPlotArea(45, 25, 239, 180);
$plotAreaObj->setBackground(0xffffc0, 0xffffe0);
#Add a legend box at (45, 20) using horizontal layout. Use 8 pt Arial font, with
#transparent background
$legendObj = $c->addLegend(45, 20, false, "", 8);
$legendObj->setBackground(Transparent);
#Add a title to the y-axis
$c->yAxis->setTitle("Throughput (MBytes Per Hour)");
#Reserve 20 pixels at the top of the y-axis for the legend box
$c->yAxis->setTopMargin(20);
#Set the x axis labels
$c->xAxis->setLabels($labels);
#Add a multi-bar layer with 3 data sets
$layer = $c->addBarLayer2(Side, 3);
$layer->addDataSet($data0, 0xff8080, "Server #1");
$layer->addDataSet($data1, 0x80ff80, "Server #2");
$layer->addDataSet($data2, 0x8080ff, "Server #3");
#output the chart
header("Content-type: image/png");
print($c->makeChart2(PNG));
?> |