| <?php
require_once("../lib/phpchartdir.php");
#The data for the line chart
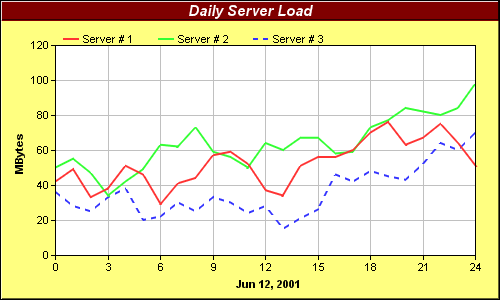
$data0 = array(42, 49, 33, 38, 51, 46, 29, 41, 44, 57, 59, 52, 37, 34, 51, 56,
56, 60, 70, 76, 63, 67, 75, 64, 51);
$data1 = array(50, 55, 47, 34, 42, 49, 63, 62, 73, 59, 56, 50, 64, 60, 67, 67,
58, 59, 73, 77, 84, 82, 80, 84, 98);
$data2 = array(36, 28, 25, 33, 38, 20, 22, 30, 25, 33, 30, 24, 28, 15, 21, 26,
46, 42, 48, 45, 43, 52, 64, 60, 70);
#The labels for the line chart
$labels = array("0", "", "", "3", "", "", "6", "", "", "9", "", "", "12", "",
"", "15", "", "", "18", "", "", "21", "", "", "24");
#Create a XYChart object of size 500 x 300 pixels, with a pale yellow (0xffff80)
#background, a black border, and 1 pixel 3D border effect
$c = new XYChart(500, 300, 0xffff80, 0x0, 1);
#Set the plotarea at (55, 45) and of size 420 x 210 pixels, with white
#background. Turn on both horizontal and vertical grid lines with light grey
#color (0xc0c0c0)
$c->setPlotArea(55, 45, 420, 210, 0xffffff, -1, -1, 0xc0c0c0, -1);
#Add a legend box at (55, 25) (top of the chart) with horizontal layout. Use 8
#pts Arial font. Set the background and border color to Transparent.
$legendObj = $c->addLegend(55, 25, false, "", 8);
$legendObj->setBackground(Transparent);
#Add a title box to the chart using 11 pts Arial Bold Italic font. The text is
#white (0xffffff) on a dark red (0x800000) background, with a 1 pixel 3D border.
$titleObj = $c->addTitle("Daily Server Load", "arialbi.ttf", 11, 0xffffff);
$titleObj->setBackground(0x800000, -1, 1);
#Add a title to the y axis
$c->yAxis->setTitle("MBytes");
#Set the labels on the x axis
$c->xAxis->setLabels($labels);
#Add a title to the x axis
$c->xAxis->setTitle("Jun 12, 2001");
#Add a line layer to the chart
$layer = $c->addLineLayer2();
#Set the default line width to 2 pixels
$layer->setLineWidth(2);
#Add the three data sets to the line layer. For demo purpose, we use a dash line
#color for the last line
$layer->addDataSet($data0, -1, "Server # 1");
$layer->addDataSet($data1, -1, "Server # 2");
$layer->addDataSet($data2, $c->dashLineColor(0x3333ff, DashLine), "Server # 3");
#output the chart
header("Content-type: image/png");
print($c->makeChart2(PNG));
?> |