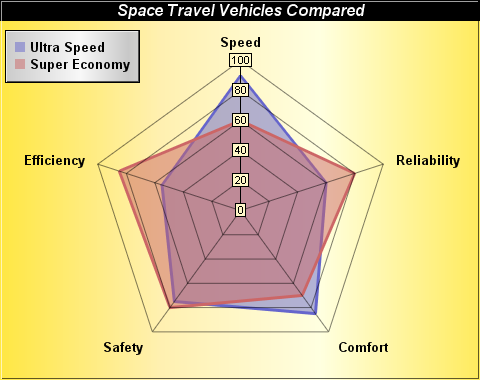
This example demonstrates a radar chart with two layers and a number of chart formatting effects.
- Create a PolarChart object using PolarChart.PolarChart.
- Set the background color to gold with 3D border effect using BaseChart.setBackground. The gold color is created using BaseChart.gradientColor with the pre-defined goldGradient constant.
- Add a title to the chart with white text on a black background using BaseChart.addTitle.
- Specify the circular plot area of the chart using PolarChart.setPlotArea.
- Add a legend box to the chart using BaseChart.addLegend. Set the legend box background to silver with 3D border effect using Box.setBackground. The silver color is created using BaseChart.gradientColor with the pre-defined silverGradient constant.
- Add two polar area layers with two data arrays using PolarChart.addAreaLayer. Use semi-transparent colors as the area fill colors to avoid the top area blocking the bottom area.
- Add two polar line layers with PolarChart.addLineLayer, using the same data arrays as the polar area layer. Set a thick line width using PolarLayer.setLineWidth. The line layers becomes borders of the area layers to highlight the areas.
- Specify the labels on the angular axis using AngularAxis.setLabels. In a polar/radar chart, the radial axis refers to the axis from the center to the perimeter of the plot area, and the angular axis refers to the axis lying on the perimeter of the plot area.
- Generate the chart using BaseChart.makeChart2.