ChartDirector Ver 3.1 (PHP Edition Edition)

Percentage Bar Chart


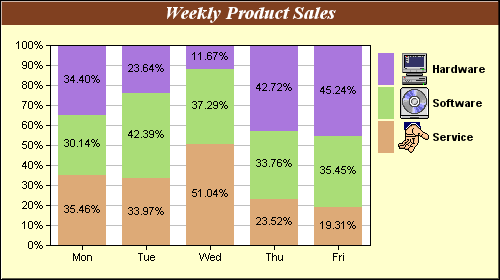
A percentage bar chart is like a stacked bar chart, except the bars are individually scaled so that they stacked up to 100.

Note that in this example, the legend box contains icons. This is achieved by including the icons in the data set name using CDML.

The key features demonstrated in this example are:

Note that by default, the data label format is {percent}% (showing the percentage) for a percentage bar layer, as opposed to {value} (showing the data value) for other types of bar layer. The data label format can be modified using Layer.setDataLabelFormat.

Source Code Listing

[File: phpdemo/percentbar.php".]
<?php require_once("../lib/phpchartdir.php"); #The data for the bar chart $data0 = array(100, 125, 245, 147, 67); $data1 = array(85, 156, 179, 211, 123); $data2 = array(97, 87, 56, 267, 157); #The labels for the bar chart $labels = array("Mon", "Tue", "Wed", "Thu", "Fri"); #Create a XYChart object of size 500 x 280 pixels, using 0xffffcc as background #color, with a black border, and 1 pixel 3D border effect $c = new XYChart(500, 280, 0xffffcc, 0, 1); #Set directory for loading images to current script directory #Need when running under Microsoft IIS $c->setSearchPath(dirname(__FILE__)); #Set the plotarea at (50, 45) and of size 320 x 200 pixels. Use white (0xffffff) #color as background. $c->setPlotArea(50, 45, 320, 200, 0xffffff); #Add a legend box at (370, 45) using vertical layout and 8 points Arial Bold #font. $legendBox = $c->addLegend(370, 45, true, "arialbd.ttf", 8); #Set the legend box background and border to transparent $legendBox->setBackground(Transparent, Transparent); #Set the legend box icon size to 16 x 32 pixels to match with custom icon size $legendBox->setKeySize(16, 32); #Add a title to the chart using 14 points Times Bold Itatic font and white font #color, and 0x804020 as the background color $titleObj = $c->addTitle("Weekly Product Sales", "timesbi.ttf", 14, 0xffffff); $titleObj->setBackground(0x804020); #Set the labels on the x axis $c->xAxis->setLabels($labels); #Add a percentage bar layer and set the layer 3D depth to 8 pixels $layer = $c->addBarLayer2(Percentage); #Add the three data sets to the bar layer, using icons images with labels as #data set names $layer->addDataSet($data0, 0xddaa77, "<*block,valign=absmiddle*><*img=service.png*> Service<*/*>"); $layer->addDataSet($data1, 0xaadd77, "<*block,valign=absmiddle*><*img=software.png*> Software<*/*>"); $layer->addDataSet($data2, 0xaa77dd, "<*block,valign=absmiddle*><*img=computer.png*> Hardware<*/*>"); #Disable bar borders by setting their colors to transparent $layer->setBorderColor(Transparent); #Enable data label at the middle of the the bar $dataLabelStyleObj = $layer->setDataLabelStyle(); $dataLabelStyleObj->setAlignment(Center); #For a vertical stacked chart with positive data only, the last data set is #always on top. However, in a vertical legend box, the last data set is at the #bottom. This can be reversed by using the setLegend method. $layer->setLegend(ReverseLegend); #output the chart header("Content-type: image/png"); print($c->makeChart2(PNG)); ?>