| <?php
require_once("../lib/phpchartdir.php");
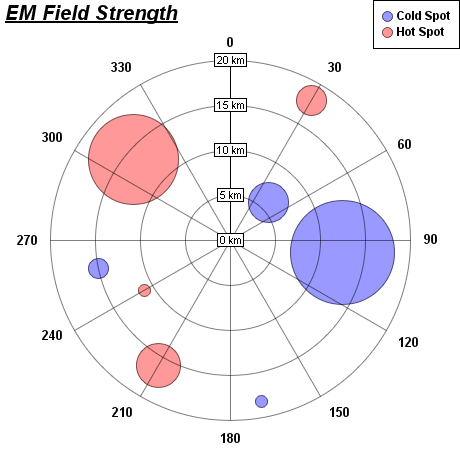
#The data for the chart
$data0 = array(6, 12.5, 18.2, 15);
$angles0 = array(45, 96, 169, 258);
$size0 = array(41, 105, 12, 20);
$data1 = array(18, 16, 11, 14);
$angles1 = array(30, 210, 240, 310);
$size1 = array(30, 45, 12, 90);
#Create a PolarChart object of size 460 x 460 pixels
$c = new PolarChart(460, 460);
#Add a title to the chart at the top left corner using 15pts Arial Bold Italic
#font
$c->addTitle2(TopLeft, "<*underline=2*>EM Field Strength", "arialbi.ttf", 15);
#Set center of plot area at (230, 240) with radius 180 pixels
$c->setPlotArea(230, 240, 180);
#Set the grid style to circular grid
$c->setGridStyle(false);
#Add a legend box at the top right corner of the chart using 9 pts Arial Bold
#font
$legendObj = $c->addLegend(459, 0, true, "arialbd.ttf", 9);
$legendObj->setAlignment(TopRight);
#Set angular axis as 0 - 360, either spoke every 30 units
$angularAxisObj = $c->angularAxis();
$angularAxisObj->setLinearScale(0, 360, 30);
#Set the radial axis label format
$radialAxisObj = $c->radialAxis();
$radialAxisObj->setLabelFormat("{value} km");
#Add a blue (0x9999ff) line layer to the chart using (data0, angle0)
$layer0 = $c->addLineLayer($data0, 0x9999ff, "Cold Spot");
$layer0->setAngles($angles0);
#Disable the line by setting its width to 0, so only the symbols are visible
$layer0->setLineWidth(0);
#Use a circular data point symbol
$layer0->setDataSymbol(CircleSymbol, 11);
#Modulate the symbol size by size0 to produce a bubble chart effect
$layer0->setSymbolScale($size0);
#Add a red (0xff9999) line layer to the chart using (data1, angle1)
$layer1 = $c->addLineLayer($data1, 0xff9999, "Hot Spot");
$layer1->setAngles($angles1);
#Disable the line by setting its width to 0, so only the symbols are visible
$layer1->setLineWidth(0);
#Use a circular data point symbol
$layer1->setDataSymbol(CircleSymbol, 11);
#Modulate the symbol size by size1 to produce a bubble chart effect
$layer1->setSymbolScale($size1);
#output the chart
header("Content-type: image/png");
print($c->makeChart2(PNG));
?> |