| <?php
require_once("../lib/phpchartdir.php");
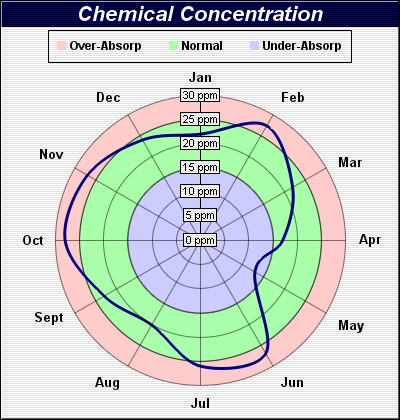
#The data for the chart
$data0 = array(22, 27.4, 22, 17, 13, 27, 26, 20.2, 23, 28, 27, 24);
#The circular data points used to represent the zones
$zone0 = array(15, 15, 15, 15, 15, 15, 15, 15, 15, 15, 15, 15);
$zone1 = array(25, 25, 25, 25, 25, 25, 25, 25, 25, 25, 25, 25);
#The labels for the chart
$labels = array("Jan", "Feb", "Mar", "Apr", "May", "Jun", "Jul", "Aug", "Sept",
"Oct", "Nov", "Dec");
#Create a PolarChart object of size 400 x 420 pixels
$c = new PolarChart(400, 420);
#Set background color to a 2 pixel pattern color, with a black border and 1
#pixel 3D border effect
$c->setBackground($c->patternColor(array(0xffffff, 0xe0e0e0), 2), 0, 1);
#Add a title to the chart using 16 pts Arial Bold Italic font. The title text is
#white (0xffffff) on 2 pixel pattern background
$titleObj = $c->addTitle("Chemical Concentration", "arialbi.ttf", 16, 0xffffff);
$titleObj->setBackground($c->patternColor(array(0x0, 0x80), 2));
#Set center of plot area at (200, 240) with radius 145 pixels. Set background
#color to 0xffcccc
$c->setPlotArea(200, 240, 145, 0xffcccc);
#Set the grid style to circular grid
$c->setGridStyle(false);
#Set the radial axis label format
$radialAxisObj = $c->radialAxis();
$radialAxisObj->setLabelFormat("{value} ppm");
#Add a legend box at (200, 30) top center aligned, using 9 pts Arial Bold font.
#with a black border, and 1 pixel 3D border effect.
$legendBox = $c->addLegend(200, 30, false, "arialbd.ttf", 9);
$legendBox->setAlignment(TopCenter);
#Add a legend key to represent the red (0xffcccc) zone
$legendBox->addKey("Over-Absorp", 0xffcccc);
#Add a spline area layer using circular data to represent the green (0xaaffaa)
#and blue (0xccccff) zones
$c->addSplineAreaLayer($zone1, 0xaaffaa, "Normal");
$c->addSplineAreaLayer($zone0, 0xccccff, "Under-Absorp");
#Add a blue (0x80) spline line layer with line width set to 3 pixels
$splineLineLayerObj = $c->addSplineLineLayer($data0, 0x80);
$splineLineLayerObj->setLineWidth(3);
#Set the labels to the angular axis as spokes. Set the font size to 10 pts
#fonts.
$angularAxisObj = $c->angularAxis();
$labelsObj = $angularAxisObj->setLabels($labels);
$labelsObj->setFontSize(10);
#output the chart
header("Content-type: image/png");
print($c->makeChart2(PNG));
?> |