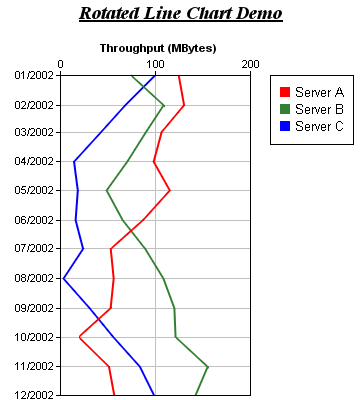
This example demonstrates swapping the x and y axes to produce a rotated line chart in which the line goes from top to bottom (instead of left to right).
The x and y axes in the example are configured as follows:
- Initially, the direction of the x-axis is left to right and is at the bottom of the chart, while the y-axis is from bottom to top and is on the left of the chart.
- Swap the x and y axes using XYChart.swapXY. Now the x-axis is from bottom to top and is on the left of the chart, while the y-axis is from left to right and is at the bottom of the chart.
- Use XYChart.setYAxisOnRight to move the y-axis to the opposite side of the plot area, so that the y-axis is on the top of the plot area (instead of at the bottom). (Note: setYAxisOnRight moves the primary y-axis to the opposite side. It is the right side by default, but will become the top side if x and y axes are swapped. The name of this method is for compatibility with earlier versions of ChartDirector in which XYChart.swapXY was not supported.)
- Use Axis.setReverse to reverse the direction of the x-axis, so that the x-axis is from top to bottom (instead of bottom to top).
For demo purposes, this example uses
RanTable to simulate a database table with 4 columns, in which one is a date/time column and the remaining three are data columns. The date/time column is passed to ChartDirector as the x values using
Layer.setXData, while the data columns are passed to ChartDirector as y values using
Layer.addDataSet.
[File: phpdemo/rotatedline.php".]
| <?php
require_once("../lib/phpchartdir.php");
#
# We use a random table to simulate generating 12 months of data
#
#Create the random table object with 4 cols * 12 rows, using 3 as seed
$rantable = new RanTable(3, 4, 12);
#Set the 1st column to be the 12 months of year 2002
$rantable->setDateCol(0, chartTime(2002, 1, 1), 86400 * 30);
#Set the 2nd, 3rd and 4th columns to be random numbers starting from 125, 75,
#and 100 respectively. The change between rows is set to -35 to + 35. The
#minimum value of any cell is 0.
$rantable->setCol(1, 125, -35, 35, 0);
$rantable->setCol(2, 75, -35, 35, 0);
$rantable->setCol(3, 100, -35, 35, 0);
#Get the 1st column (time) as the x data
$dataX = $rantable->getCol(0);
#Get the 2nd, 3rd and 4th columns as 3 data sets
$dataY0 = $rantable->getCol(1);
$dataY1 = $rantable->getCol(2);
$dataY2 = $rantable->getCol(3);
#Create a XYChart object of size 360 x 400 pixels
$c = new XYChart(360, 400);
#Add a title to the chart
$c->addTitle("<*underline=2*>Rotated Line Chart Demo", "timesbi.ttf", 14);
#Set the plotarea at (60, 75) and of size 190 x 320 pixels. Turn on both
#horizontal and vertical grid lines with light grey color (0xc0c0c0)
$plotAreaObj = $c->setPlotArea(60, 75, 190, 320);
$plotAreaObj->setGridColor(0xc0c0c0, 0xc0c0c0);
#Add a legend box at (270, 75)
$c->addLegend(270, 75);
#Swap the x and y axis to become a rotated chart
$c->swapXY();
#Set the y axis on the top side (right + rotated = top)
$c->setYAxisOnRight();
#Add a title to the y axis
$c->yAxis->setTitle("Throughput (MBytes)");
#Reverse the x axis so it is pointing downwards
$c->xAxis->setReverse();
#Add a line chart layer using the given data
$layer = $c->addLineLayer2();
$layer->setXData($dataX);
$layer->addDataSet($dataY0, 0xff0000, "Server A");
$layer->addDataSet($dataY1, 0x338033, "Server B");
$layer->addDataSet($dataY2, 0xff, "Server C");
#Set the line width to 2 pixels
$layer->setLineWidth(2);
#output the chart
header("Content-type: image/png");
print($c->makeChart2(PNG));
?> |
© 2004 Advanced Software Engineering Limited. All rights reserved.