| <?php
require_once("../lib/phpchartdir.php");
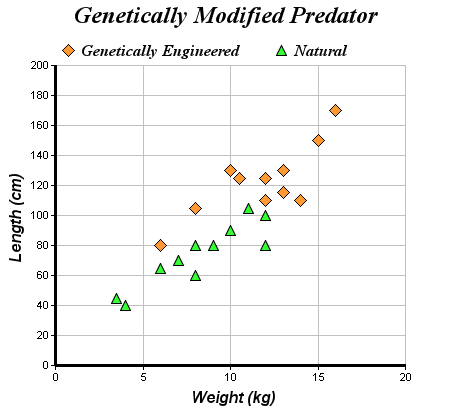
#The XY points for the scatter chart
$dataX0 = array(10, 15, 6, 12, 14, 8, 13, 13, 16, 12, 10.5);
$dataY0 = array(130, 150, 80, 110, 110, 105, 130, 115, 170, 125, 125);
$dataX1 = array(6, 12, 4, 3.5, 7, 8, 9, 10, 12, 11, 8);
$dataY1 = array(65, 80, 40, 45, 70, 80, 80, 90, 100, 105, 60);
#Create a XYChart object of size 450 x 420 pixels
$c = new XYChart(450, 420);
#Set the plotarea at (55, 65) and of size 350 x 300 pixels, with a light grey
#border (0xc0c0c0). Turn on both horizontal and vertical grid lines with light
#grey color (0xc0c0c0)
$c->setPlotArea(55, 65, 350, 300, -1, -1, 0xc0c0c0, 0xc0c0c0, -1);
#Add a legend box at (50, 30) (top of the chart) with horizontal layout. Use 12
#pts Times Bold Italic font. Set the background and border color to Transparent.
$legendObj = $c->addLegend(50, 30, false, "timesbi.ttf", 12);
$legendObj->setBackground(Transparent);
#Add a title to the chart using 18 pts Times Bold Itatic font.
$c->addTitle("Genetically Modified Predator", "timesbi.ttf", 18);
#Add a title to the y axis using 12 pts Arial Bold Italic font
$c->yAxis->setTitle("Length (cm)", "arialbi.ttf", 12);
#Add a title to the x axis using 12 pts Arial Bold Italic font
$c->xAxis->setTitle("Weight (kg)", "arialbi.ttf", 12);
#Set the axes line width to 3 pixels
$c->xAxis->setWidth(3);
$c->yAxis->setWidth(3);
#Add an orange (0xff9933) scatter chart layer, using 13 pixel diamonds as
#symbols
$c->addScatterLayer($dataX0, $dataY0, "Genetically Engineered", DiamondSymbol,
13, 0xff9933);
#Add a green (0x33ff33) scatter chart layer, using 11 pixel triangles as symbols
$c->addScatterLayer($dataX1, $dataY1, "Natural", TriangleSymbol, 11, 0x33ff33);
#output the chart
header("Content-type: image/png");
print($c->makeChart2(PNG));
?> |