| <?php
require_once("../lib/phpchartdir.php");
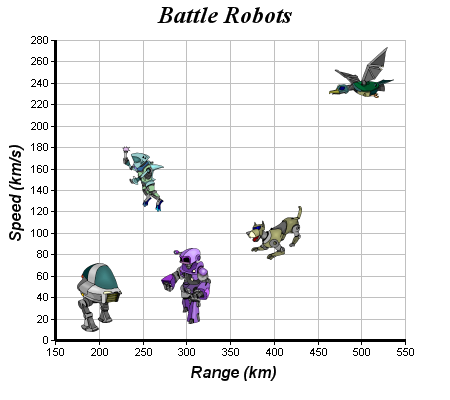
#The XY points for the scatter chart
$dataX = array(200, 400, 300, 250, 500);
$dataY = array(40, 100, 50, 150, 250);
#The custom symbols for the points
$symbols = array("robot1.png", "robot2.png", "robot3.png", "robot4.png",
"robot5.png");
#Create a XYChart object of size 450 x 400 pixels
$c = new XYChart(450, 400);
#Set the plotarea at (55, 40) and of size 350 x 300 pixels, with a light grey
#border (0xc0c0c0). Turn on both horizontal and vertical grid lines with light
#grey color (0xc0c0c0)
$c->setPlotArea(55, 40, 350, 300, -1, -1, 0xc0c0c0, 0xc0c0c0, -1);
#Add a title to the chart using 18 pts Times Bold Itatic font.
$c->addTitle("Battle Robots", "timesbi.ttf", 18);
#Add a title to the y axis using 12 pts Arial Bold Italic font
$c->yAxis->setTitle("Speed (km/s)", "arialbi.ttf", 12);
#Add a title to the y axis using 12 pts Arial Bold Italic font
$c->xAxis->setTitle("Range (km)", "arialbi.ttf", 12);
#Set the axes line width to 3 pixels
$c->xAxis->setWidth(3);
$c->yAxis->setWidth(3);
#Add each point of the data as a separate scatter layer, so that they can have a
#different symbol
for($i = 0; $i < count($dataX); ++$i) {
$scatterLayerObj = $c->addScatterLayer(array($dataX[$i]), array($dataY[$i]))
;
$getDataSetObj = $scatterLayerObj->getDataSet(0);
$getDataSetObj->setDataSymbol(dirname(__FILE__)."/".$symbols[$i]);
}
#output the chart
header("Content-type: image/png");
print($c->makeChart2(PNG));
?> |