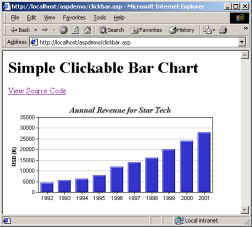
In this example, we will create a bar chart that displays the annual revenue of
a company for the last 10 years. When a bar is clicked, the browser will load a
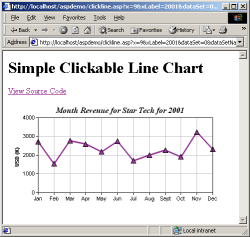
line chart showing the monthly revenue for the selected year. When the line
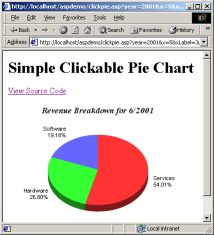
chart is clicked, the browser will load a pie chart showing the breakdown of the
revenue for the selected month. When the pie chart is clicked, it will show the
sector details in a web page.
The capability is often called "drill-down", because the user can "zoom-in" to
get more details by clicking on the chart.
[File: phpdemo/clickbar.php".]
| <?php
require_once("../lib/phpchartdir.php");
#
#For demo purpose, we use hard coded data. In real life, the following data
#could come from a database.
#
$revenue = array(4500, 5600, 6300, 8000, 12000, 14000, 16000, 20000, 24000,
28000);
$labels = array("1992", "1993", "1994", "1995", "1996", "1997", "1998", "1999",
"2000", "2001");
#Create a XYChart object of size 450 x 200 pixels
$c = new XYChart(450, 200);
#Add a title to the chart using Times Bold Italic font
$c->addTitle("Annual Revenue for Star Tech", "timesbi.ttf");
#Set the plotarea at (60, 25) and of size 350 x 150 pixels
$c->setPlotArea(60, 25, 350, 150);
#Add a blue (0x3333cc) bar chart layer using the given data. Set the bar border
#to 1 pixel 3D style.
$barLayerObj = $c->addBarLayer($revenue, 0x3333cc, "Revenue");
$barLayerObj->setBorderColor(-1, 1);
#Set x axis labels using the given labels
$c->xAxis->setLabels($labels);
#Add a title to the y axis
$c->yAxis->setTitle("USD (K)");
#Create the image and save it in a temporary location
$chart1URL = $c->makeSession("chart1");
#Create an image map for the chart
$imageMap = $c->getHTMLImageMap("clickline.php", "",
"title='{xLabel}: USD {value|0}K'");
?>
<html>
<body>
<h1>Simple Clickable Bar Chart</h1>
<p><a href="viewsource.php?file=<?php echo $HTTP_SERVER_VARS["SCRIPT_NAME"]?>">
View Source Code
</a></p>
<img src="myimage.php?<?php echo $chart1URL?>" border="0" usemap="#map1">
<map name="map1">
<?php echo $imageMap?>
</map>
</body>
</html> |
In the above code, the chart is created and saved in a session variable using
BaseChart.makeSession. An <IMG> tag is used to retrieve the chart with
"myimage.php?<?php echo $chart1URL?>" as the URL.
"myimage.php" is a simple utility that comes with ChartDirector for retrieving images from
session variables.
The image map for the chart is created using the following code:
|
$imageMap = $c->getHTMLImageMap("clickline.php", "",
"title='{xLabel}: USD {value|0}K'");
|
As seen above, only one line of code is needed.
BaseChart.getHTMLImageMap will
generate the image map for the entire chart. The image map will use "clickline.php"
as the handler when a bar is clicked.
If you right click on the browser and choose "View Source" to look at the HTML
of the web page as received by the browser, you can see that the image map
generated above will be something like:
|
<area shape="rect" coords="65,152,90,175" title='1992: USD 4500K'
href="clickline.php?x=0&xLabel=1992&dataSet=0&dataSetName=Revenue&value=4500">
<area shape="rect" coords="100,147,125,175" title='1993: USD 5600K'
href="clickline.php?x=1&xLabel=1993&dataSet=0&dataSetName=Revenue&value=5600">
<area shape="rect" coords="135,143,160,175" title='1994: USD 6300K'
href="clickline.php?x=2&xLabel=1994&dataSet=0&dataSetName=Revenue&value=6300">
<area shape="rect" coords="169,135,194,175" title='1995: USD 8000K'
href="clickline.php?x=3&xLabel=1995&dataSet=0&dataSetName=Revenue&value=8000">
...... (one <area> tag for each bar) ...... |
The image map generated by ChartDirector contains one <AREA> tag per bar.
This defines the bars as hot spots. The "href" attributes of the <AREA>
tags use "clickline.php" as the URL, with query parameters appended to
describe the bars. In this way, "clickline.php" can distinguish which bar the
user has clicked.
The <AREA> tags also include "title" attributes, which act as tool tips
when the mouse pointer moves over the bars. In this example, the tool tips are
in the format:
"title='{xLabel}: USD {value|0}K'"
which is specified as the third argument of
BaseChart.getHTMLImageMap.
As mentioned above, the "myimage.php" is a simply utility used to retrieve
the image from a session variable and
returns it to the browser.
[File: phpdemo/myimage.php".]
| <?php
if (!session_id()) { session_start(); }
print $HTTP_SESSION_VARS[$HTTP_GET_VARS["img"]];
?> |
In the previous Clickable Bar Chart sample code, when a bar is clicked, the
handler "clickline.php" will be invoked.
The code for the image map handler "clickline.php" is listed below. It
determines which year the user has clicked from query parameters. It
then draws a line chart based on the selected year. To produce a
clickable line chart, it generates and saves the chart in a
session variable using
BaseChart.makeSession
, and generates the image map using
BaseChart.getHTMLImageMap, with "clickpie.php" as the handler.
As "clickline.php" is very similar to "clickbar.php", it will not be explained
further here.
[File: phpdemo/clickline.php".]
| <?php
require_once("../lib/phpchartdir.php");
#Get the selected year.
$selectedYear = $HTTP_GET_VARS["xLabel"];
#Get the total revenue
$totalRevenue = $HTTP_GET_VARS["value"];
#
# In this demo, we just split the total revenue into 12 months using random
# numbers. In real life, the data can come from a database.
#
srand($selectedYear);
$data = array_pad(array(), 12, 0);
for($i = 0; $i < 11; ++$i) {
$data[$i] = $totalRevenue * (rand() / getrandmax() * 0.6 + 0.6) / (12 - $i);
$totalRevenue = $totalRevenue - $data[$i];
}
$data[11] = $totalRevenue;
#
# Now we obtain the data into arrays, we can start to draw the chart using
# ChartDirector
#
#Create a XYChart object of size 450 x 200 pixels
$c = new XYChart(450, 200);
#Add a title to the chart
$c->addTitle("Month Revenue for Star Tech for $selectedYear", "timesbi.ttf");
#Set the plotarea at (60, 5) and of size 350 x 150 pixels. Enable both
#horizontal and vertical grids by setting their colors to grey (0xc0c0c0)
$plotAreaObj = $c->setPlotArea(60, 25, 350, 150);
$plotAreaObj->setGridColor(0xc0c0c0, 0xc0c0c0);
#Add a line chart layer using the data
$lineLayerObj = $c->addLineLayer();
$dataSet = $lineLayerObj->addDataSet($data, 0x993399);
#Set the line width to 3 pixels
$dataSet->setLineWidth(3);
#Use a 11 point triangle symbol to plot the data points
$dataSet->setDataSymbol(TriangleSymbol, 11);
#Set the x axis labels. In this example, the labels must be Jan - Dec.
$labels = array("Jan", "Feb", "Mar", "Apr", "May", "Jun", "Jul", "Aug", "Sept",
"Oct", "Nov", "Dec");
$c->xAxis->setLabels($labels);
#Add a title to the x axis to reflect the selected year
$c->xAxis->setTitle("Year $selectedYear");
#Add a title to the y axis
$c->yAxis->setTitle("USD (K)");
#Reserve 10% margin at the top of the plot area just to make sure the line does
#not go too near the top of the plot area
$c->yAxis->setAutoScale(0.1);
#Create the image and save it in a temporary location
$chart1URL = $c->makeSession("chart1");
#Create an image map for the chart
$imageMap = $c->getHTMLImageMap("clickpie.php?year=$selectedYear", "",
"title='{xLabel}: USD {value|0}K'");
?>
<html>
<body>
<h1>Simple Clickable Line Chart</h1>
<p><a href="viewsource.php?file=<?php echo $HTTP_SERVER_VARS["SCRIPT_NAME"]?>">
View Source Code
</a></p>
<img src="myimage.php?<?php echo $chart1URL?>" border="0" usemap="#map1">
<map name="map1">
<?php echo $imageMap?>
</map>
</body>
</html> |
In the previous Clickable Line Chart sample code, when a line is clicked, the
handler "clickpie.php" will be invoked.
The code for "clickpie.php" is listed below. It determines which year and month
the user has clicked from query parameters. It then draws a pie chart based
on those parameters. To produce a clickable pie chart, it generates
and saves the chart in a session variable using
BaseChart.makeSession,
and generates the image map using
BaseChart.getHTMLImageMap, with
"piestub.php" as the handler.
As "clickpie.php" is very similar to "clickbar.php" and "clickline.php", it will
not be explained further here.
[File: phpdemo/clickpie.php".]
| <?php
require_once("../lib/phpchartdir.php");
#Get the selected year and month
$selectedYear = $HTTP_GET_VARS["year"];
$selectedMonth = $HTTP_GET_VARS["x"] + 1;
#Get the monthly revenue
$monthlyRevenue = $HTTP_GET_VARS["value"];
#
# In this demo, we just split the total revenue into 3 parts using random
# numbers. In real life, the data probably can come from a database.
#
srand($selectedMonth * 2000 + $selectedYear);
$data = array_pad(array(), 3, 0);
$data[0] = (rand() / getrandmax() * 0.1 + 0.5) * $monthlyRevenue;
$data[1] = (rand() / getrandmax() * 0.1 + 0.2) * $monthlyRevenue;
$data[2] = $monthlyRevenue - $data[0] - $data[1];
#The labels for the pie chart
$labels = array("Services", "Hardware", "Software");
#Create a PieChart object of size 360 x 260 pixels
$c = new PieChart(360, 260);
#Set the center of the pie at (180, 140) and the radius to 100 pixels
$c->setPieSize(180, 130, 100);
#Add a title to the pie chart using 13 pts Times Bold Italic font
$c->addTitle("Revenue Breakdown for $selectedMonth/$selectedYear",
"timesbi.ttf", 13);
#Draw the pie in 3D
$c->set3D();
#Set the pie data and the pie labels
$c->setData($data, $labels);
#Create the image and save it in a temporary location
$chart1URL = $c->makeSession("chart1");
#Create an image map for the chart
$imageMap = $c->getHTMLImageMap("piestub.php", "",
"title='{label}:USD {value|0}K'");
?>
<html>
<body>
<h1>Simple Clickable Pie Chart</h1>
<p><a href="viewsource.php?file=<?php echo $HTTP_SERVER_VARS["SCRIPT_NAME"]?>">
View Source Code
</a></p>
<img src="myimage.php?<?php echo $chart1URL?>" border="0" usemap="#map1">
<map name="map1">
<?php echo $imageMap?>
</map>
</body>
</html> |
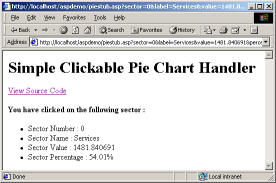
In the previous Clickable Pie Chart sample code, when a sector is clicked, the
handler "piestub.php" will be invoked. Its code is listed below. In this
example, "piestub.php" simply displays some data about the sector clicked.
[File: phpdemo/piestub.php".]
|
<html>
<body>
<h1>Simple Clickable Pie Chart Handler</h1>
<p><a href="viewsource.php?file=<?php echo $HTTP_SERVER_VARS["SCRIPT_NAME"]?>">
View Source Code
</a></p>
<p><b>You have clicked on the following sector :</b></p>
<ul>
<li>Sector Number : <?php echo $HTTP_GET_VARS["sector"]?></li>
<li>Sector Name : <?php echo $HTTP_GET_VARS["label"]?></li>
<li>Sector Value : <?php echo $HTTP_GET_VARS["value"]?></li>
<li>Sector Percentage : <?php echo $HTTP_GET_VARS["percent"]?>%</li>
</ul>
</body>
</html> |
© 2004 Advanced Software Engineering Limited. All rights reserved.