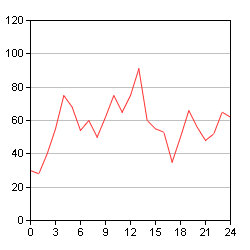
This example demonstrates the following basic steps in creating line chart:
- Create a XYChart object using XYChart.XYChart.
- Specify the plot area of the chart using XYChart.setPlotArea. The plot area is the rectangle bounded by the x and y axes. You should leave some margin on the outside of the plot area for axis labels, chart titles, etc.
- Specify the labels on the x-axis using Axis.setLabels.
- Add a line layer and specify the data for the line using XYChart.addLineLayer.
- Generate the chart using BaseChart.makeChart2.