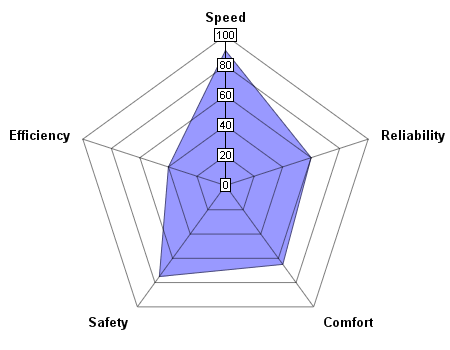
This example demonstrates the following basic steps in creating a radar chart:
- Create a PolarChart object using PolarChart.PolarChart.
- Specify the circular plot area of the chart using PolarChart.setPlotArea.
- Add a polar area layer and specify the data for the area using PolarChart.addAreaLayer.
- Specify the labels on the angular axis using AngularAxis.setLabels. In a polar/radar chart, the radial axis refers to the axis from the center to the perimeter of the plot area, and the angular axis refers to the axis lying on the perimeter of the plot area.
- Generate the chart using BaseChart.makeChart2.