| <?php
require_once("../lib/phpchartdir.php");
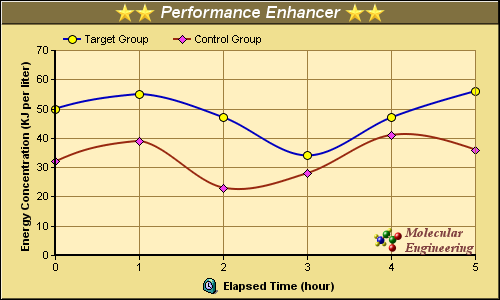
#The data for the chart
$data0 = array(32, 39, 23, 28, 41, 36);
$data1 = array(50, 55, 47, 34, 47, 56);
#The labels for the chart
$labels = array("0", "1", "2", "3", "4", "5");
#Create a XYChart object of size 500 x 300 pixels, using 0xf0e090 as the
#background color, with a black border, and 1 pixel 3D border effect.
$c = new XYChart(500, 300, 0xf0e090, 0x0, 1);
#Set directory for loading images to current script directory
#Need when running under Microsoft IIS
$c->setSearchPath(dirname(__FILE__));
#Set the plotarea at (55, 50) and of size 420 x 205 pixels, using 0xfff0c0 as
#the plot area background color, and 0xa08040 as the grid and border colors.
#Turn on both horizontal and vertical grid lines with light grey color
#(0xc0c0c0)
$c->setPlotArea(55, 50, 420, 205, 0xfff0c0, -1, 0xa08040, 0xa08040, 0xa08040);
#Add a legend box at (55, 25) (top of the chart) with horizontal layout. Use 8
#pts Arial font. Set the background and border color to Transparent.
$legendObj = $c->addLegend(55, 25, false, "", 8);
$legendObj->setBackground(Transparent);
#Add a title box to the chart using 13 pts Arial Bold Italic font. The title is
#in CDML and includes embedded images for highlight. The text is white
#(0xffffff) on a brown (0x807040) background, with a 1 pixel 3D border.
$titleObj = $c->addTitle(
"<*block,valign=absmiddle*><*img=star.png*><*img=star.png*> Performance ".
"Enhancer <*img=star.png*><*img=star.png*><*/*>", "arialbi.ttf", 13,
0xffffff);
$titleObj->setBackground(0x807040, -1, 1);
#Add a title to the y axis
$c->yAxis->setTitle("Energy Concentration (KJ per liter)");
#Set the labels on the x axis
$c->xAxis->setLabels($labels);
#Add a title to the x axis using CMDL
$c->xAxis->setTitle(
"<*block,valign=absmiddle*><*img=clock.png*> Elapsed Time (hour)<*/*>");
#Set the axes width to 2 pixels
$c->xAxis->setWidth(2);
$c->yAxis->setWidth(2);
#Add a spline layer to the chart
$layer = $c->addSplineLayer();
#Set the default line width to 2 pixels
$layer->setLineWidth(2);
#Add a data set to the spline layer, using blue (0xc0) as the line color, with
#yellow (0xffff00) circle symbols.
$dataSetObj = $layer->addDataSet($data1, 0xc0, "Target Group");
$dataSetObj->setDataSymbol(CircleSymbol, 9, 0xffff00);
#Add a data set to the spline layer, using brown (0x982810) as the line color,
#with pink (0xf040f0) diamond symbols.
$dataSetObj = $layer->addDataSet($data0, 0x982810, "Control Group");
$dataSetObj->setDataSymbol(DiamondSymbol, 9, 0xf040f0);
#Add a custom CDML text at the bottom right of the plot area as the logo
$textObj = $c->addText(475, 255,
"<*block,valign=absmiddle*><*img=small_molecule.png*> <*block*>".
"<*font=timesbi.ttf,size=10,color=804040*>Molecular\nEngineering<*/*>");
$textObj->setAlignment(BottomRight);
#output the chart
header("Content-type: image/png");
print($c->makeChart2(PNG));
?> |