| <?php
require_once("../lib/phpchartdir.php");
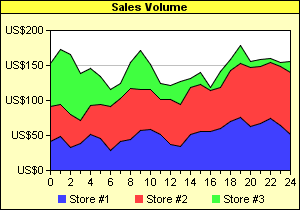
#The data for the area chart
$data0 = array(42, 49, 33, 38, 51, 46, 29, 41, 44, 57, 59, 52, 37, 34, 51, 56,
56, 60, 70, 76, 63, 67, 75, 64, 51);
$data1 = array(50, 45, 47, 34, 42, 49, 63, 62, 73, 59, 56, 50, 64, 60, 67, 67,
58, 59, 73, 77, 84, 82, 80, 84, 89);
$data2 = array(61, 79, 85, 66, 53, 39, 24, 21, 37, 56, 37, 22, 21, 33, 13, 17,
4, 23, 16, 25, 9, 10, 5, 7, 16);
$labels = array("0", "-", "2", "-", "4", "-", "6", "-", "8", "-", "10", "-",
"12", "-", "14", "-", "16", "-", "18", "-", "20", "-", "22", "-", "24");
#Create a XYChart object of size 300 x 210 pixels. Set the background to pale
#yellow (0xffffc0) with a black border (0x0)
$c = new XYChart(300, 210, 0xffffc0, 0x0);
#Set the plotarea at (50, 30) and of size 240 x 140 pixels. Use white (0xffffff)
#background.
$plotAreaObj = $c->setPlotArea(50, 30, 240, 140);
$plotAreaObj->setBackground(0xffffff);
#Add a legend box at (50, 185) (below of plot area) using horizontal layout. Use
#8 pts Arial font with Transparent background.
$legendObj = $c->addLegend(50, 185, false, "", 8);
$legendObj->setBackground(Transparent);
#Add a title box to the chart using 8 pts Arial Bold font, with yellow
#(0xffff40) background and a black border (0x0)
$titleObj = $c->addTitle("Sales Volume", "arialbd.ttf", 8);
$titleObj->setBackground(0xffff40, 0);
#Set the y axis label format to US$nnnn
$c->yAxis->setLabelFormat("US\${value}");
#Set the x axis labels using the given labels
$c->xAxis->setLabels($labels);
#Add an stack area layer with three data sets
$layer = $c->addAreaLayer2(Stack);
$layer->addDataSet($data0, 0x4040ff, "Store #1");
$layer->addDataSet($data1, 0xff4040, "Store #2");
$layer->addDataSet($data2, 0x40ff40, "Store #3");
#output the chart
header("Content-type: image/png");
print($c->makeChart2(PNG));
?> |