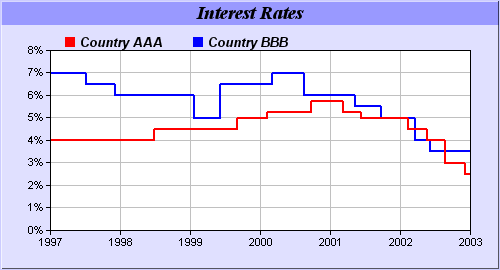
This example demonstrates joining data points with steps. It also demonstrates irregularly spaced data points on a true date/time axis.
The step line layer is created using XYChart.addStepLineLayer.
Most of the sample charts in this document use enumerated x-axes. In this axis type, the data points are assumed to be evenly spread on the x-direction, so it is not necessary to supply the x values of the data points. The x-axis is treated as a series of text labels using Axis.setLabels. The labels can be dates/times, numbers, names, or any arbitrary text in any format. Enumerated x-axis is an easy to use yet extremely flexible axis type that is suitable for most charts.
However, for charts with data points not regularly spaced, it is necessary to supply the x values of the data points using Layer.setXData. In this case, ChartDirector can automatically determine the type and scale on the x-axis (auto-scaling).
For date/time axis, in many cases one may need to control the date/time label format. This can be done using Axis.setDateScale3.
| Because in ChartDirector, dates/times are also represented as numbers (as seconds elapsed since 1-1-01 00:00:00 - this is to support programming languages that do not have a date/time data type), it cannot distinguish for sure if the x values are dates/times or numeric quantities. Instead, ChartDirector assumes that if the all x-values are between year 1800 (=56770934400) and year 2200 (=69393715200), the x-axis represents date/time, otherwise it represents numeric quantities. It is unlikely but possible that ChartDirector may mistaken a date/time axis as a numeric axis (linear axis) if the date/time is outside of year 1800 - 2200. Conversely, it may mistaken a linear axis as a date/time axis if all x values happen to be in the range 56770934400 - 69393715200. In these case, you may use the Axis.setLinearScale3 or Axis.setDateScale3 to explicitly inform ChartDirector the axis type. |