| <?php
require_once("../lib/phpchartdir.php");
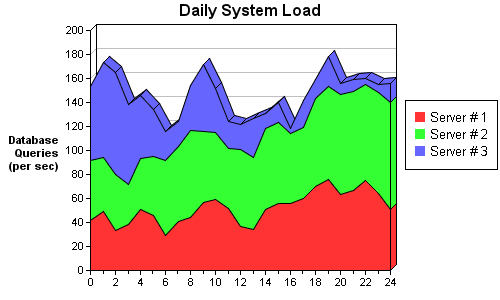
#The data for the area chart
$data0 = array(42, 49, 33, 38, 51, 46, 29, 41, 44, 57, 59, 52, 37, 34, 51, 56,
56, 60, 70, 76, 63, 67, 75, 64, 51);
$data1 = array(50, 45, 47, 34, 42, 49, 63, 62, 73, 59, 56, 50, 64, 60, 67, 67,
58, 59, 73, 77, 84, 82, 80, 84, 89);
$data2 = array(61, 79, 85, 66, 53, 39, 24, 21, 37, 56, 37, 22, 21, 33, 13, 17,
4, 23, 16, 25, 9, 10, 5, 7, 16);
$labels = array("0", "-", "2", "-", "4", "-", "6", "-", "8", "-", "10", "-",
"12", "-", "14", "-", "16", "-", "18", "-", "20", "-", "22", "-", "24");
#Create a XYChart object of size 500 x 300 pixels
$c = new XYChart(500, 300);
#Set the plotarea at (90, 30) and of size 300 x 240 pixels.
$c->setPlotArea(90, 30, 300, 240);
#Add a legend box at (405, 100)
$c->addLegend(405, 100);
#Add a title to the chart
$c->addTitle("Daily System Load");
#Add a title to the y axis. Draw the title upright (font angle = 0)
$titleObj = $c->yAxis->setTitle("Database\nQueries\n(per sec)");
$titleObj->setFontAngle(0);
#Set the labels on the x axis
$c->xAxis->setLabels($labels);
#Add an area layer
$layer = $c->addAreaLayer();
#Draw the area layer in 3D
$layer->set3D();
#Add the three data sets to the area layer
$layer->addDataSet($data0, -1, "Server # 1");
$layer->addDataSet($data1, -1, "Server # 2");
$layer->addDataSet($data2, -1, "Server # 3");
#output the chart
header("Content-type: image/png");
print($c->makeChart2(PNG));
?> |