This example illustrates how to control the axis tick density in auto-scaling.
In auto-scaling, ChartDirector will automatically choose an appropriate tick spacing for the axis.
In some special cases, you may want to use a different tick spacing. The
Axis.setTickDensity method can be used to specify the desired distance between two ticks.
Note that the actual tick spacing chosen by ChartDirector may not be equal to the given desired tick density. It is because ChartDirector may have other constraints when choosing the ticks. For example, the axis may need to contain an integral number of ticks (depends on
Axis.setRounding set up), the ticks and axis range should be neat numbers, etc. ChartDirector may use a tick spacing that is larger than suggested, but never smaller.
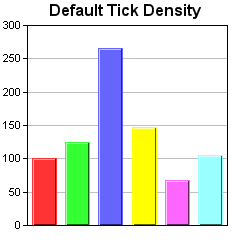
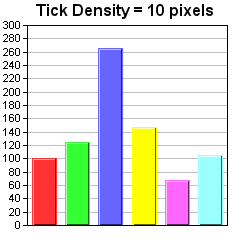
In this example, one of the charts is drawn using the default tick spacing. The other chart is drawn using a desired tick spacing of 10 pixels. Note that the actual tick spacing is slightly larger than 10 pixels.
[File: phpdemo/ticks.php".]
| <?php
require_once("../lib/phpchartdir.php");
#The data for the chart
$data = array(100, 125, 265, 147, 67, 105);
$labels = array("Jan", "Feb", "Mar", "Apr", "May", "Jun");
#Create a XYChart object of size 250 x 250 pixels
$c = new XYChart(250, 250);
#Set the plot area at (27, 25) and of size 200 x 200 pixels
$c->setPlotArea(27, 25, 200, 200);
if ($HTTP_GET_VARS["img"] == "1") {
#High tick density, uses 10 pixels as tick spacing
$c->addTitle("Tick Density = 10 pixels");
$c->yAxis->setTickDensity(10);
} else {
#Normal tick density, just use the default setting
$c->addTitle("Default Tick Density");
}
#Set the labels on the x axis
$c->xAxis->setLabels($labels);
#Add a color bar layer using the given data. Use a 1 pixel 3D border for the
#bars.
$barLayer3Obj = $c->addBarLayer3($data);
$barLayer3Obj->setBorderColor(-1, 1);
#output the chart
header("Content-type: image/png");
print($c->makeChart2(PNG));
?> |
© 2004 Advanced Software Engineering Limited. All rights reserved.