This example illustrates how to control scaling of an axis.
By default, ChartDirector will auto-scaled all axes. The
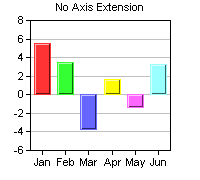
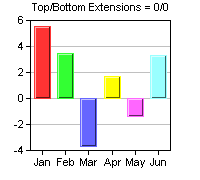
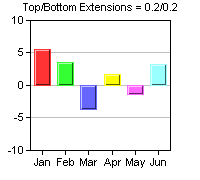
Axis.setAutoScale method controls the top extension, bottom extension and the zero affinity parameters that ChartDirector uses during auto-scaling. The first three charts demonstrates the effects of different top/bottom extensions. (Please refer to
Axis.setAutoScale on what these parameters mean.)
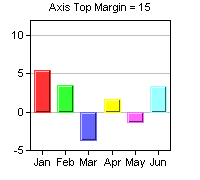
The fourth chart demonstrates that one could exclude a segment on the ends of an axis from scaling using
Axis.setMargin.
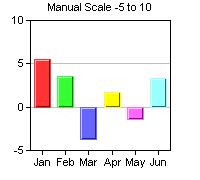
The fifth chart demonstrates using manual scaling instead of auto-scaling. A manual linear scale can be configured using
Axis.setLinearScale or
Axis.setLinearScale2. ChartDirector also supports
Axis.setLogScale,
Axis.setLogScale2,
Axis.setDateScale and
Axis.setDateScale2 for configuring manual log and date scales.
[File: phpdemo/axisscale.php".]
| <?php
require_once("../lib/phpchartdir.php");
#The data for the chart
$data = array(5.5, 3.5, -3.7, 1.7, -1.4, 3.3);
$labels = array("Jan", "Feb", "Mar", "Apr", "May", "Jun");
#Create a XYChart object of size 200 x 180 pixels
$c = new XYChart(200, 180);
#Set the plot area at (30, 20) and of size 140 x 130 pixels
$c->setPlotArea(30, 20, 140, 130);
#Configure the axis as according to the input parameter
if ($HTTP_GET_VARS["img"] == "0") {
$c->addTitle("No Axis Extension", "arial.ttf", 8);
} else if ($HTTP_GET_VARS["img"] == "1") {
$c->addTitle("Top/Bottom Extensions = 0/0", "arial.ttf", 8);
#Reserve 20% margin at top of plot area when auto-scaling
$c->yAxis->setAutoScale(0, 0);
} else if ($HTTP_GET_VARS["img"] == "2") {
$c->addTitle("Top/Bottom Extensions = 0.2/0.2", "arial.ttf", 8);
#Reserve 20% margin at top and bottom of plot area when auto-scaling
$c->yAxis->setAutoScale(0.2, 0.2);
} else if ($HTTP_GET_VARS["img"] == "3") {
$c->addTitle("Axis Top Margin = 15", "arial.ttf", 8);
#Reserve 15 pixels at top of plot area
$c->yAxis->setMargin(15);
} else {
$c->addTitle("Manual Scale -5 to 10", "arial.ttf", 8);
#Set the y axis to scale from -5 to 10, with ticks every 5 units
$c->yAxis->setLinearScale(-5, 10, 5);
}
#Set the labels on the x axis
$c->xAxis->setLabels($labels);
#Add a color bar layer using the given data. Use a 1 pixel 3D border for the
#bars.
$barLayer3Obj = $c->addBarLayer3($data);
$barLayer3Obj->setBorderColor(-1, 1);
#output the chart
header("Content-type: image/png");
print($c->makeChart2(PNG));
?> |
© 2004 Advanced Software Engineering Limited. All rights reserved.