ChartDirector Ver 3.1 (PHP Edition Edition)

Box-Whisker Chart


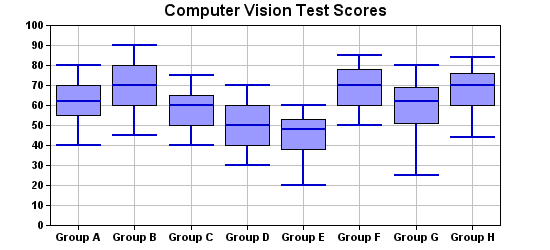
A traditional box-whisker chart represent 5 data series using box-whisker symbols, where the 5 data series are maximum, 3rd quartile, median, 1st quartile and minimum of some quantities. The 3rd and 1st quartile values are represented as a box. The maximum, minimum and median values are represented as horizontal marks. There is a vertical line joining the maximum and minimum marks.

In ChartDirector, you may use any data quantities for the box-whisker layer. Also, the ChartDirector box-whisker layer can support more than 5 data series. Additional data series are represented as marks similar to the median mark. You can also leave out some data series.

For example, to create a floating box chart, you may supply only the 3rd and 1st quartile series and leave out the other three series. Similarly, you can create a chart with only the maximum and minimum marks and the vertical joining line by leaving out the 3rd quartile, median and 1st quartile values. The latter chart is useful to represent error range by inserting it under a line layer.

Source Code Listing

[File: phpdemo/boxwhisker.php".]
<?php require_once("../lib/phpchartdir.php"); #Sample data for the Box-Whisker chart. Represents the minimum, 1st quartile, #medium, 3rd quartile and maximum values of some quantities $Q0Data = array(40, 45, 40, 30, 20, 50, 25, 44); $Q1Data = array(55, 60, 50, 40, 38, 60, 51, 60); $Q2Data = array(62, 70, 60, 50, 48, 70, 62, 70); $Q3Data = array(70, 80, 65, 60, 53, 78, 69, 76); $Q4Data = array(80, 90, 75, 70, 60, 85, 80, 84); #The labels for the chart $labels = array("Group A", "Group B", "Group C", "Group D", "Group E", "Group F", "Group G", "Group H"); #Create a XYChart object of size 550 x 250 pixels $c = new XYChart(550, 250); #Set the plotarea at (50, 25) and of size 450 x 200 pixels. Enable both #horizontal and vertical grids by setting their colors to grey (0xc0c0c0) $plotAreaObj = $c->setPlotArea(50, 25, 450, 200); $plotAreaObj->setGridColor(0xc0c0c0, 0xc0c0c0); #Add a title to the chart $c->addTitle("Computer Vision Test Scores"); #Set the labels on the x axis and the font to Arial Bold $labelsObj = $c->xAxis->setLabels($labels); $labelsObj->setFontStyle("arialbd.ttf"); #Set the font for the y axis labels to Arial Bold $c->yAxis->setLabelStyle("arialbd.ttf"); #Add a Box Whisker layer using light blue 0x9999ff as the fill color and blue #(0xcc) as the line color. Set the line width to 2 pixels $boxWhiskerLayerObj = $c->addBoxWhiskerLayer($Q3Data, $Q1Data, $Q4Data, $Q0Data, $Q2Data, 0x9999ff, 0xcc); $boxWhiskerLayerObj->setLineWidth(2); #output the chart header("Content-type: image/png"); print($c->makeChart2(PNG)); ?>


.htm">PNGA constant representing the format of the image. Must be one of the pre-defined constants PNG, JPG, GIF, BMP or WMP.

Return Value

A string representing the query parameters for retrieving the image using the myimage.php utility.


Chart.gradientColor.htm">gradientColor(Self)Create a two-point gradient color.gradientColor2(Self)Create a multi-point gradient color.setDefaultFonts(Self)Set the defaults for normal, bold, italic and bold-italic fonts.setFontTable(Self)Set an entry in the font table to the specified font name.setNumberFormat(Self)Set the characters used for thousand separator, decimal point, and negative sign.setMonthNames(Self)Set the names of the months for date/time formatting purposes.setWeekDayNames(Self)Set the names of the week days for date/time formatting purposes.setAMPM(Self)Set the names to be used to denote morning and afternoon.layout(Self)Perform auto-scaling of the axis and compute the positions of the various objects in the chart.makeChart(Self)Generate the chart image and save it into a file.makeChart2(Self)Generate the chart as an image in memory.makeChart3(Self)Generate the chart in internal format and return a DrawArea object to allow adding custom drawings on top of the chart.makeSession(Self)Generate the chart as an image and save it to a session variable.getHTMLImageMap(Self)Generate an HTML image map for the chart.
">© 2004 Advanced Software Engineering Limited. All rights reserved. d>lowess(Self)Fit a curve through the data points in the ArrayMath object using the LOWESS algorithm.lowess2(Self)Fit a curve through the data points in the ArrayMath object using the LOWESS algorithm, where the spacing of the data points is supplied by the given array.result(Self)Get the content of the ArrayMath object as a normal array to be used in other ChartDirector API.max(Self)Get the maximum value of the elements of the ArrayMath object.min(Self)Get the minimum value of the elements of the ArrayMath object.avg(Self)Get the average value of the elements of the ArrayMath object.sum(Self)Get the total value of the elements of the ArrayMath object.med(Self)Get the median value of the elements of the ArrayMath object.percentile(Self)Get the required percentile value of the elements of the ArrayMath object.maxIndex(Self)Get the index of the maximum value element of the ArrayMath object.minIndex(Self)Get the index of the minimum value element of the ArrayMath object.
(1059, '1999-03-01', '371', '635', '722');