ChartDirector Ver 3.1 (PHP Edition Edition)

Bubble Chart


In ChartDirector, a bubble chart can be created as a scatter layer with circles as symbols using XYChart.addScatterLayer. The sizes of the symbols are then controlled by another data series (z data) using LineLayer.setSymbolScale. This creates circles of different sizes.

By default, ChartDirector handles z data using pixel units. That means a z value of 50 will result in a symbol size of 50 pixels. If your z data are too small or too large, you could re-scale them using ArrayMath.mul before passing them to LineLayer.setSymbolScale.

ChartDirector also supports handling the z data using the same scale as the y (or x) axis, using additional arguments when calling LineLayer.setSymbolScale. This feature is useful if the symbol sizes reflect some features of the y (or x) data, such as the standard deviation or confidence of the y (or x) value.

Source Code Listing

[File: phpdemo/bubble.php".]
<?php require_once("../lib/phpchartdir.php"); #
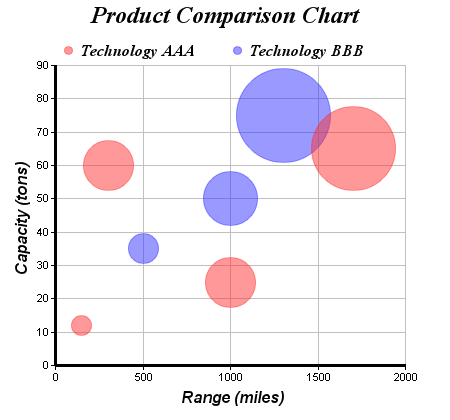
The XYZ points for the bubble chart $dataX0 = array(150, 300, 1000, 1700); $dataY0 = array(12, 60, 25, 65); $dataZ0 = array(20, 50, 50, 85); $dataX1 = array(500, 1000, 1300); $dataY1 = array(35, 50, 75); $dataZ1 = array(30, 55, 95); #Create a XYChart object of size 450 x 420 pixels $c = new XYChart(450, 420); #Set the plotarea at (55, 65) and of size 350 x 300 pixels, with a light grey #border (0xc0c0c0). Turn on both horizontal and vertical grid lines with light #grey color (0xc0c0c0) $c->setPlotArea(55, 65, 350, 300, -1, -1, 0xc0c0c0, 0xc0c0c0, -1); #Add a legend box at (50, 30) (top of the chart) with horizontal layout. Use 12 #pts Times Bold Italic font. Set the background and border color to Transparent. $legendObj = $c->addLegend(50, 30, false, "timesbi.ttf", 12); $legendObj->setBackground(Transparent); #Add a title to the chart using 18 pts Times Bold Itatic font. $c->addTitle("Product Comparison Chart", "timesbi.ttf", 18); #Add a title to the y axis using 12 pts Arial Bold Italic font $c->yAxis->setTitle("Capacity (tons)", "arialbi.ttf", 12); #Add a title to the x axis using 12 pts Arial Bold Italic font $c->xAxis->setTitle("Range (miles)", "arialbi.ttf", 12); #Set the axes line width to 3 pixels $c->xAxis->setWidth(3); $c->yAxis->setWidth(3); #Add (dataX0, dataY0) as a scatter layer with semi-transparent red (0x80ff3333) #circle symbols, where the circle size is modulated by dataZ0. This creates a #bubble effect. $scatterLayerObj = $c->addScatterLayer($dataX0, $dataY0, "Technology AAA", CircleSymbol, 9, 0x80ff3333, 0x80ff3333); $scatterLayerObj->setSymbolScale($dataZ0); #Add (dataX1, dataY1) as a scatter layer with semi-transparent green #(0x803333ff) circle symbols, where the circle size is modulated by dataZ1. This #creates a bubble effect. $scatterLayerObj = $c->addScatterLayer($dataX1, $dataY1, "Technology BBB", CircleSymbol, 9, 0x803333ff, 0x803333ff); $scatterLayerObj->setSymbolScale($dataZ1); #output the chart header("Content-type: image/png"); print($c->makeChart2(PNG)); ?>


lStyleLayerEnable aggregate labels and set their styles.setAggregateLabelFormatLayerSet the aggregate label format.addCustomAggregateLabelLayerAdd a custom aggregate label to an aggregated object.getImageCoorLayerGet the image map coordinates of a data point as represented in the layer as HTML image map attributes.getImageCoor2LayerGet the image map coordinates of a region containing all data points at the given x-position as HTML image map attributes.getHTMLImageMapLayerGenerate the HTML image map for all data points as represented on the layer.setHTMLImageMapLayerOverride the default arguments used when generating HTML image map for the layer.
td>Set the names to be used to denote morning and afternoon.layout(Self)Perform auto-scaling of the axis and compute the positions of the various objects in the chart.makeChart(Self)Generate the chart image and save it into a file.makeChart2(Self)Generate the chart as an image in memory.makeChart3(Self)Generate the chart in internal format and return a DrawArea object to allow adding custom drawings on top of the chart.makeSession(Self)Generate the chart as an image and save it to a session variable.getHTMLImageMap(Self)Generate an HTML image map for the chart.
">© 2004 Advanced Software Engineering Limited. All rights reserved. d>lowess(Self)Fit a curve through the data points in the ArrayMath object using the LOWESS algorithm.lowess2(Self)Fit a curve through the data points in the ArrayMath object using the LOWESS algorithm, where the spacing of the data points is supplied by the given array.result(Self)Get the content of the ArrayMath object as a normal array to be used in other ChartDirector API.max(Self)Get the maximum value of the elements of the ArrayMath object.min(Self)Get the minimum value of the elements of the ArrayMath object.avg(Self)Get the average value of the elements of the ArrayMath object.sum(Self)Get the total value of the elements of the ArrayMath object.med(Self)Get the median value of the elements of the ArrayMath object.percentile(Self)Get the required percentile value of the elements of the ArrayMath object.maxIndex(Self)Get the index of the maximum value element of the ArrayMath object.minIndex(Self)Get the index of the minimum value element of the ArrayMath object.
(1059, '1999-03-01', '371', '635', '722');