| <?php
require_once("../lib/phpchartdir.php");
#
#Sample data for the CandleStick chart.
#
$highData = array(2043, 2039, 2076, 2064, 2048, 2058, 2070, 2033, 2027, 2029,
2071, 2085, 2034, 2031, 2056, 2128, 2180, 2183, 2192, 2213, 2230, 2281, 2272
);
$lowData = array(1931, 1921, 1985, 2028, 1986, 1994, 1999, 1958, 1943, 1944,
1962, 2011, 1975, 1962, 1928, 2059, 2112, 2103, 2151, 2127, 2123, 2152, 2212
);
$openData = array(2000, 1957, 1993, 2037, 2018, 2021, 2045, 2009, 1959, 1985,
2008, 2048, 2006, 2010, 1971, 2080, 2116, 2137, 2170, 2172, 2171, 2191, 2240
);
$closeData = array(1950, 1991, 2026, 2029, 2004, 2053, 2011, 1962, 1987, 2019,
2040, 2016, 1996, 1985, 2006, 2113, 2142, 2167, 2158, 2201, 2188, 2231, 2242
);
#The labels for the CandleStick chart
$labels = array("Mon 1", "Tue 2", "Wed 3", "Thu 4", "Fri 5", "Mon 8", "Tue 9",
"Wed 10", "Thu 11", "Fri 12", "Mon 15", "Tue 16", "Wed 17", "Thu 18",
"Fri 19", "Mon 22", "Tue 23", "Wed 24", "Thu 25", "Fri 26", "Mon 29",
"Tue 30", "Wed 31");
#Create a XYChart object of size 600 x 350 pixels
$c = new XYChart(600, 350);
#Set the plotarea at (50, 25) and of size 500 x 250 pixels. Enable both the
#horizontal and vertical grids by setting their colors to grey (0xc0c0c0)
$plotAreaObj = $c->setPlotArea(50, 25, 500, 250);
$plotAreaObj->setGridColor(0xc0c0c0, 0xc0c0c0);
#Add a title to the chart
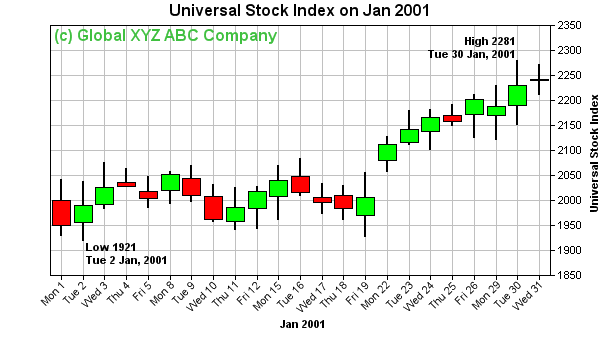
$c->addTitle("Universal Stock Index on Jan 2001");
#Add a custom text at (50, 25) (the upper left corner of the plotarea). Use 12
#pts Arial Bold/pale green (0x40c040) as the font.
$c->addText(50, 25, "(c) Global XYZ ABC Company", "arialbd.ttf", 12, 0x40c040);
#Add a title to the x axis
$c->xAxis->setTitle("Jan 2001");
#Set the labels on the x axis. Rotate the labels by 45 degrees.
$labelsObj = $c->xAxis->setLabels($labels);
$labelsObj->setFontAngle(45);
#Add a title to the y axis
$c->yAxis->setTitle("Universal Stock Index");
#Draw the y axis on the right hand side of the plot area
$c->setYAxisOnRight(true);
#Reserve 10% margin at the top and bottom of the plot area during auto-scaling.
#This is to leave space for the high and low data labels.
$c->yAxis->setAutoScale(0.1, 0.1);
#Add a CandleStick layer to the chart using green (0xff00) for up candles and
#red (0xff0000) for down candles
$layer = $c->addCandleStickLayer($highData, $lowData, $openData, $closeData,
0xff00, 0xff0000);
#Set the line width to 2 pixels
$layer->setLineWidth(2);
#
#Now we add the "High" and "Low" text labels. We first find out which are the
#highest and lowest positions.
#
$obj = new ArrayMath($highData);
$highPos = $obj->maxIndex();
$obj = new ArrayMath($lowData);
$lowPos = $obj->minIndex();
#By default, we put text at the center position. If the data point is too close
#to the right or left border of the plot area, we align the text to the right
#and left to avoid the text overflows outside the plot area
$align = BottomCenter;
if ($highPos > 18) {
$align = BottomRight;
} else if ($highPos < 5) {
$align = BottomLeft;
}
#Add the custom high label at the high position
$customDataLabelObj = $layer->addCustomDataLabel(0, $highPos,
"High {high}\n{xLabel} Jan, 2001", "arialbd.ttf");
$customDataLabelObj->setAlignment($align);
#Similarly, we compute the alignment for the low label based on its x position.
$align = TopCenter;
if ($lowPos > 18) {
$align = TopRight;
} else if ($lowPos < 5) {
$align = TopLeft;
}
#Add the custom low label at the low position
$customDataLabelObj = $layer->addCustomDataLabel(0, $lowPos,
"Low {low}\n{xLabel} Jan, 2001", "arialbd.ttf");
$customDataLabelObj->setAlignment($align);
#output the chart
header("Content-type: image/png");
print($c->makeChart2(PNG));
?> |