| <?php
require_once("../lib/phpchartdir.php");
#The data for the pie chart
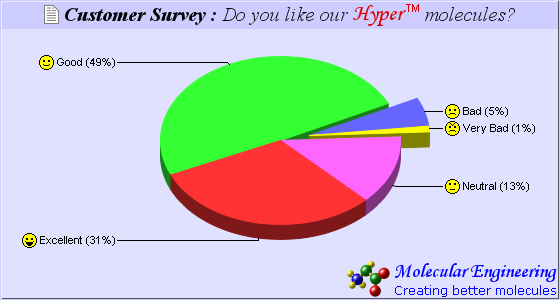
$data = array(28, 45, 5, 1, 12);
#The labels for the pie chart
$labels = array("Excellent", "Good", "Bad", "Very Bad", "Neutral");
#The icons for the sectors
$icons = array("laugh.png", "smile.png", "sad.png", "angry.png", "nocomment.png"
);
#Create a PieChart object of size 560 x 300 pixels, using 0xe0e0ff as the
#background color, 0xccccff as the border color, with 1 pixel 3D border effect
$c = new PieChart(560, 300, 0xe0e0ff, 0xccccff, 1);
#Set directory for loading images to current script directory
#Need when running under Microsoft IIS
$c->setSearchPath(dirname(__FILE__));
#Set the center of the pie at (280, 140) and the radius to 100 pixels
$c->setPieSize(280, 140, 120);
#Add a title box with title written in CDML
$titleObj = $c->addTitle(
"<*block,valign=absmiddle*><*img=doc.png*><*font=timesbi.ttf,size=15*> ".
"Customer Survey : <*font=timesi.ttf*>Do you like our <*block,valign=top*>".
"<*font=mtcorsva.ttf,color=dd0000,size=17*>Hyper<*block*>".
"<*font=arial.ttf,size=8*> TM<*/*><*/*> molecules?<*/*>");
$titleObj->setBackground(0xccccff);
#Add a logo to the chart written in CDML as the bottom title aligned to the
#bottom right
$c->addTitle2(BottomRight,
"<*block,valign=absmiddle*><*img=molecule.png*> <*block*><*color=FF*>".
"<*font=mtcorsva.ttf,size=15*>Molecular Engineering\n".
"<*font=verdana.ttf,size=9*>Creating better molecules<*/*>");
#Set the pie data and the pie labels
$c->setData($data, $labels);
#Set 3D style
$c->set3D();
#Use the side label layout method
$c->setLabelLayout(SideLayout);
#Set the label background color to transparent
$labelStyleObj = $c->setLabelStyle();
$labelStyleObj->setBackground(Transparent);
#Set the join line color to black
$c->setJoinLine(0);
#Add icons to the chart as a custom field
$c->addExtraField($icons);
#Configure the sector labels using CDML to include the icon images
$c->setLabelFormat(
"<*block,valign=absmiddle*><*img={field0}*> {label} ({percent|0}%)");
#Explode the 3rd and 4th sectors as a group (index = 2 and 3)
$c->setExplodeGroup(2, 3);
#Set the start angle to 135 degrees may improve layout when there are many small
#sectors at the end of the data array (that is, data sorted in descending
#order). It is because this makes the small sectors position near the horizontal
#axis, where the text label has the least tendency to overlap. For data sorted
#in ascending order, a start angle of 45 degrees can be used instead.
$c->setStartAngle(135);
#output the chart
header("Content-type: image/png");
print($c->makeChart2(PNG));
?> |