| <?php
require_once("../lib/phpchartdir.php");
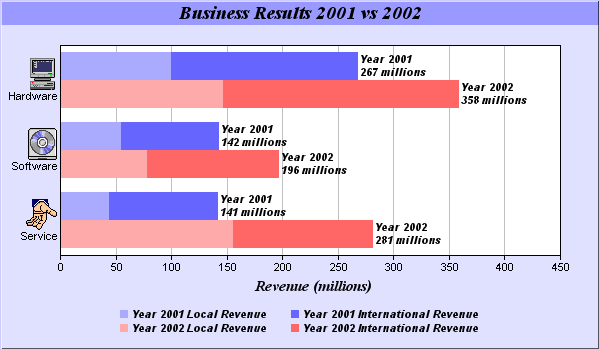
#The data for the bar chart
$data0 = array(44, 55, 100);
$data1 = array(97, 87, 167);
$data2 = array(156, 78, 147);
$data3 = array(125, 118, 211);
#The labels for the bar chart. The labels contains embedded images as icons.
$labels = array("<*img=service.png*><*br*>Service",
"<*img=software.png*><*br*>Software", "<*img=computer.png*><*br*>Hardware");
#Create a XYChart object of size 600 x 350 pixels, using 0xe0e0ff as the
#background color, 0xccccff as the border color, with 1 pixel 3D border effect.
$c = new XYChart(600, 350, 0xe0e0ff, 0xccccff, 1);
#Set directory for loading images to current script directory
#Need when running under Microsoft IIS
$c->setSearchPath(dirname(__FILE__));
#Add a title to the chart using 14 points Times Bold Itatic font and light blue
#(0x9999ff) as the background color
$titleObj = $c->addTitle("Business Results 2001 vs 2002", "timesbi.ttf", 14);
$titleObj->setBackground(0x9999ff);
#Set the plotarea at (60, 45) and of size 500 x 210 pixels, using white
#(0xffffff) as the background
$c->setPlotArea(60, 45, 500, 210, 0xffffff);
#Swap the x and y axes to create a horizontal bar chart
$c->swapXY();
#Add a title to the y axis using 11 pt Times Bold Italic as font
$c->yAxis->setTitle("Revenue (millions)", "timesbi.ttf", 11);
#Set the labels on the x axis
$c->xAxis->setLabels($labels);
#Disable x-axis ticks by setting the tick length to 0
$c->xAxis->setTickLength(0);
#Add a stacked bar layer to the chart
$layer = $c->addBarLayer2(Stack);
#Add the first two data sets to the chart as a stacked bar group
$layer->addDataGroup("2001");
$layer->addDataSet($data0, 0xaaaaff, "Local");
$layer->addDataSet($data1, 0x6666ff, "International");
#Add the remaining data sets to the chart as another stacked bar group
$layer->addDataGroup("2002");
$layer->addDataSet($data2, 0xffaaaa, "Local");
$layer->addDataSet($data3, 0xff6666, "International");
#Set the sub-bar gap to 0, so there is no gap between stacked bars with a group
$layer->setBarGap(0.2, 0);
#Set the bar border to transparent
$layer->setBorderColor(Transparent);
#Set the aggregate label format
$layer->setAggregateLabelFormat("Year {dataGroupName}\n{value} millions");
#Set the aggregate label font to 8 point Arial Bold Italic
$layer->setAggregateLabelStyle("arialbi.ttf", 8);
#Reverse 20% space at the right during auto-scaling to allow space for the
#aggregate bar labels
$c->yAxis->setAutoScale(0.2);
#Add a legend box at (300, 300) using TopCenter alignment, with horizontal
#layout, and using 8 pt Arial Bold Italic as the font
$legendBox = $c->addLegend(300, 300, false, "arialbi.ttf", 8);
$legendBox->setAlignment(TopCenter);
#Set the legend box width to 500 pixels (height = automatic)
$legendBox->setSize(500, 0);
#Set the format of the text displayed in the legend box
$legendBox->setText("Year {dataGroupName} {dataSetName} Revenue");
#Set the background and border of the legend box to transparent
$legendBox->setBackground(Transparent, Transparent);
#output the chart
header("Content-type: image/png");
print($c->makeChart2(PNG));
?> |