| <?php
require_once("../lib/phpchartdir.php");
#The data for the chart
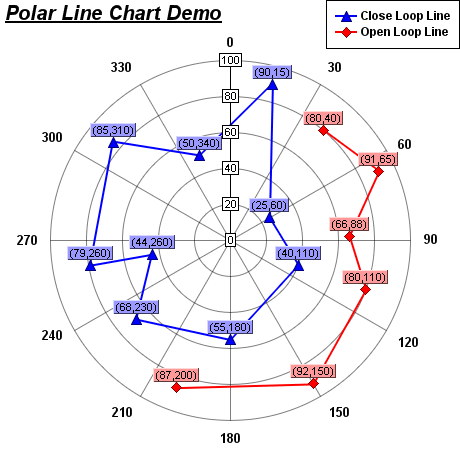
$data0 = array(90, 25, 40, 55, 68, 44, 79, 85, 50);
$angles0 = array(15, 60, 110, 180, 230, 260, 260, 310, 340);
$data1 = array(80, 91, 66, 80, 92, 87);
$angles1 = array(40, 65, 88, 110, 150, 200);
#Create a PolarChart object of size 460 x 460 pixels
$c = new PolarChart(460, 460);
#Add a title to the chart at the top left corner using 15pts Arial Bold Italic
#font
$c->addTitle2(TopLeft, "<*underline=2*>Polar Line Chart Demo", "arialbi.ttf", 15
);
#Set center of plot area at (230, 240) with radius 180 pixels
$c->setPlotArea(230, 240, 180);
#Set the grid style to circular grid, with grids below the chart layers
$c->setGridStyle(false, false);
#Add a legend box at the top right corner of the chart using 9 pts Arial Bold
#font
$legendObj = $c->addLegend(459, 0, true, "arialbd.ttf", 9);
$legendObj->setAlignment(TopRight);
#Set angular axis as 0 - 360, either spoke every 30 units
$angularAxisObj = $c->angularAxis();
$angularAxisObj->setLinearScale(0, 360, 30);
#Add a blue (0xff) line layer to the chart using (data0, angle0)
$layer0 = $c->addLineLayer($data0, 0xff, "Close Loop Line");
$layer0->setAngles($angles0);
#Set the line width to 2 pixels
$layer0->setLineWidth(2);
#Use 11 pixel triangle symbols for the data points
$layer0->setDataSymbol(TriangleSymbol, 11);
#Enable data label and set its format
$layer0->setDataLabelFormat("({value},{angle})");
#Set the data label text box with light blue (0x9999ff) backgruond color and 1
#pixel 3D border effect
$dataLabelStyleObj = $layer0->setDataLabelStyle();
$dataLabelStyleObj->setBackground(0x9999ff, Transparent, 1);
#Add a red (0xff0000) line layer to the chart using (data1, angle1)
$layer1 = $c->addLineLayer($data1, 0xff0000, "Open Loop Line");
$layer1->setAngles($angles1);
#Set the line width to 2 pixels
$layer1->setLineWidth(2);
#Use 11 pixel diamond symbols for the data points
$layer1->setDataSymbol(DiamondSymbol, 11);
#Set the line to open loop
$layer1->setCloseLoop(false);
#Enable data label and set its format
$layer1->setDataLabelFormat("({value},{angle})");
#Set the data label text box with light red (0xff9999) backgruond color and 1
#pixel 3D border effect
$dataLabelStyleObj = $layer1->setDataLabelStyle();
$dataLabelStyleObj->setBackground(0xff9999, Transparent, 1);
#output the chart
header("Content-type: image/png");
print($c->makeChart2(PNG));
?> |