This example demonstrates how to modify the coloring scheme using
BaseChart.setColor,
BaseChart.setColors and
BaseChart.setColors2, and apply a background image to the chart using
BaseChart.setWallpaper.
[File: phpdemo/colorpie.php".]
| <?php
require_once("../lib/phpchartdir.php");
#The data for the pie chart
$data = array(25, 18, 15, 12, 8, 30, 35);
#The labels for the pie chart
$labels = array("Labor", "Licenses", "Taxes", "Legal", "Insurance",
"Facilities", "Production");
#Colors of the sectors if custom coloring is used
$colors = array(0xb8bc9c, 0xecf0b9, 0x999966, 0x333366, 0xc3c3e6, 0x594330,
0xa0bdc4);
#Create a PieChart object of size 280 x 240 pixels
$c = new PieChart(280, 240);
#Set the center of the pie at (140, 120) and the radius to 80 pixels
$c->setPieSize(140, 120, 80);
#Draw the pie in 3D
$c->set3D();
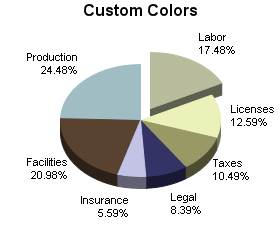
#Set the coloring schema
if ($HTTP_GET_VARS["img"] == "0") {
$c->addTitle("Custom Colors");
#set the LineColor to light gray
$c->setColor(LineColor, 0xc0c0c0);
#use given color array as the data colors (sector colors)
$c->setColors2(DataColor, $colors);
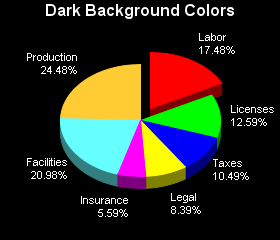
} else if ($HTTP_GET_VARS["img"] == "1") {
$c->addTitle("Dark Background Colors");
#use the standard white on black palette
$c->setColors($whiteOnBlackPalette);
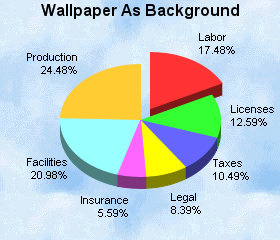
} else if ($HTTP_GET_VARS["img"] == "2") {
$c->addTitle("Wallpaper As Background");
$c->setWallpaper(dirname(__FILE__)."/bg.png");
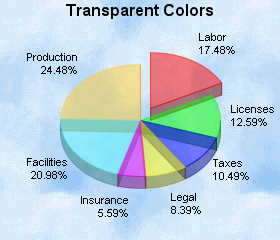
} else {
$c->addTitle("Transparent Colors");
$c->setWallpaper(dirname(__FILE__)."/bg.png");
#use semi-transparent colors to allow the background to be seen
$c->setColors($transparentPalette);
}
#Set the pie data and the pie labels
$c->setData($data, $labels);
#Explode the 1st sector (index = 0)
$c->setExplode(0);
#output the chart
header("Content-type: image/png");
print($c->makeChart2(PNG));
?> |
© 2004 Advanced Software Engineering Limited. All rights reserved.